
Figure 10.
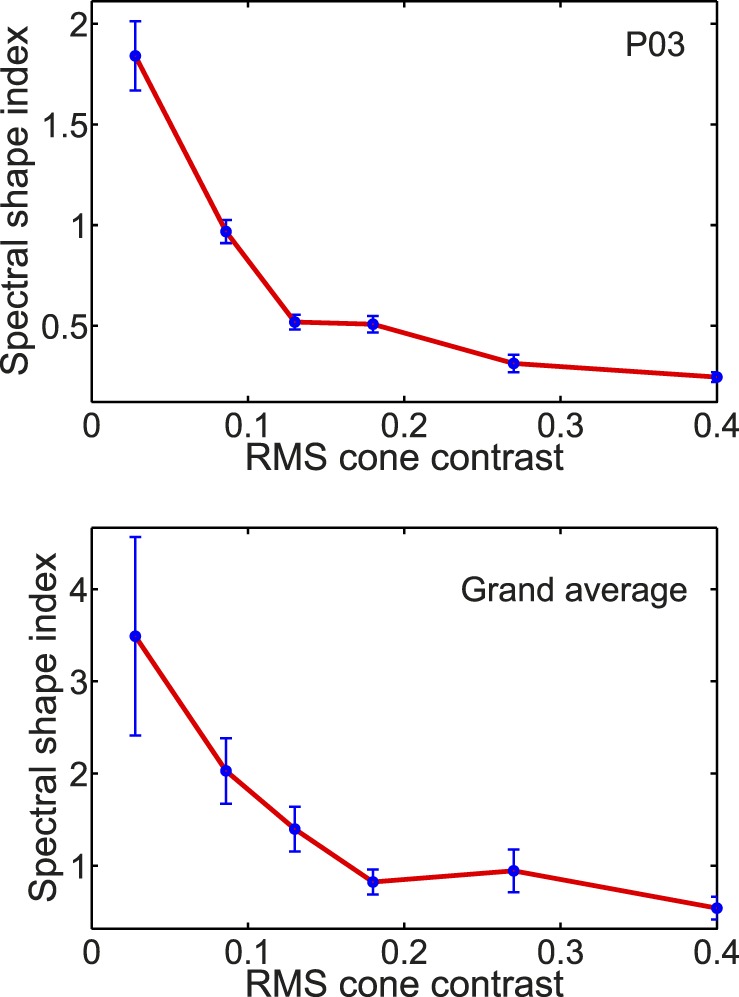
Spectral shape index, defined as the ratio of the first harmonic amplitude to the mean of the second and third harmonic amplitudes, plotted as a function of RMS cone contrast for one participant (top) and averaged over all participants (bottom). In the graph for a single participant (top), error bars were calculated from the Tcirc2 statistic of Victor and Mast (1991). For the grand average (bottom) the error bars represent ±1 SEM.