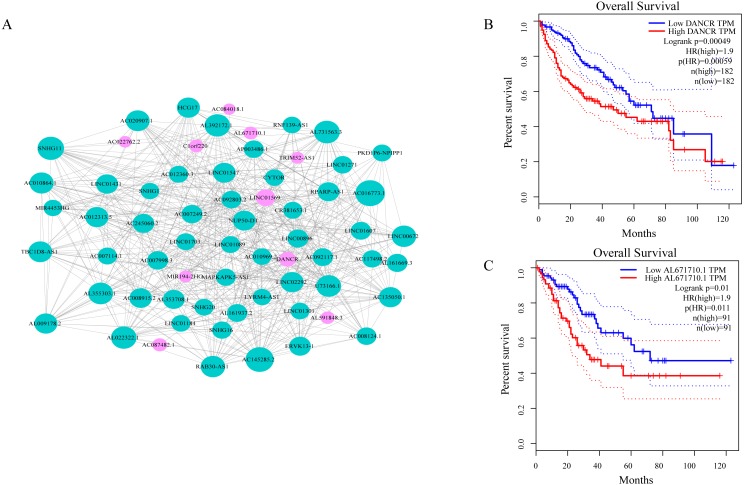
Figure 3. CeRNA network in LIHC and survival curves.
(A) Red dots represent overlaping lncRNA selected from co-expression analysis and RNA22 which can identify microRNA binding sites. The bigger the dots, the higher the degree value, the more important nodes in the network. (B) Survival curve of patients with high expression of DANCR and low expression of DANCR. Survival curve of patients with high expression of AL671710.1 and low expression of AL671710.1.

