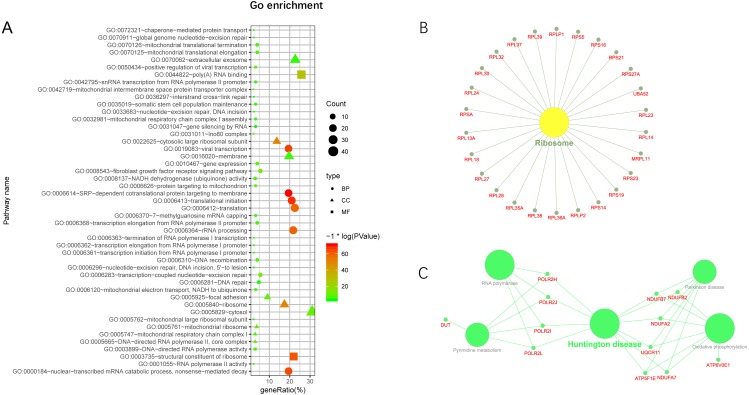
Figure 5. GO and KEGG pathway enrichment analysis of target gene.
(A) GO enrichment of mRNA interact with lncRNA. Points of different shapes represent BP, CC and MF of GO, and the size of points represents the number of gene enriched in the GO function; the number of different colors represents P value. (B) The KEGG pathway is enriched in ribosome and in Huntington’s disease.

