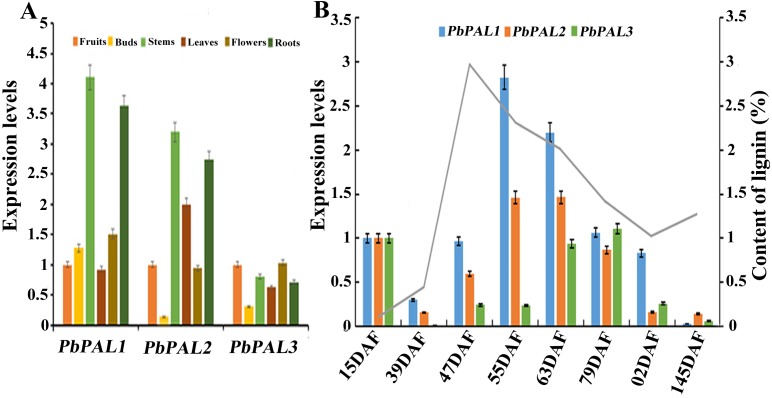
Figure 5. Expression analysis of PbPALs at various tissues of pear (A) and at different stages of fruit development (B).
Fifteen days after flowering (DAF), 39 DAF, 47 DAF, 55 DAF, 63 DAF, 79 DAF, 102 DAF and mature stage (145 DAF), respectively. Y-axes on the left indicates the relative gene expression levels; (X-axis) by bar charts, and the Y-axes on right showed content of lignin during fruit development with line charts. Each histogram represents the mean value and the bar ± standard error of three biological replicates. The material used to determine the level of expression is not derived from the material used to determine lignin.

