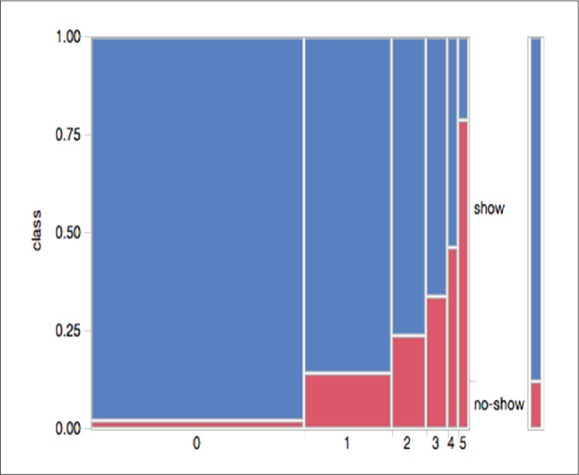
Figure 1.

Distribution of no-show by the historic no-show rate (Example: patients who have a historic no-show rate greater than 50% [category 5] had the highest probability of not showing at the next appointment [79.1%]). Historic no-show rate was the most important predictor of future no-shows.
