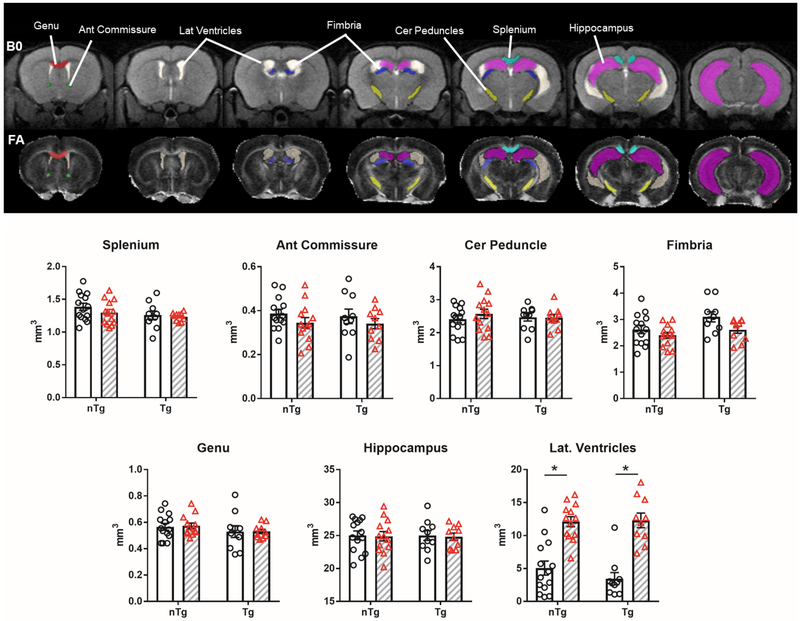
Figure 1.
IL6 increased lateral ventricle volume in transgenic CRND8 mice (TgCRND8) and non-transgenic (nTg) controls. No volumetric differences were observed in white matter (WM) and hippocampus. Top) Segmented ROIs are overlaid on representative B0 and FA maps and ROI names are indicated on the B0 map. Color-filled ROI are: anterior commissure (green), genu (red), ventricles (beige), fimbria (purple). Cerebral peduncle (yellow), splenium (light blue), hippocampus (fuscia). Bottom) WM and hippocampus volumes (y-axis is mm3). Clear bars (and clear circles) are control groups and grey hashed bars (and red triangles) are IL6 treated mice. *significant difference between control and IL6 (Tukey’s post hoc test, p<0.05). All data represented as bar graphs are mean ± standard error.

