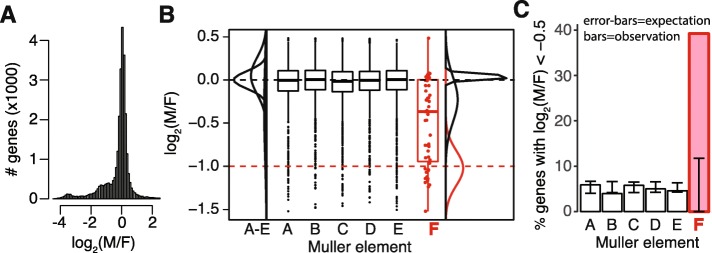
Fig. 2.
Reduced male-to-female sequence coverage of Muller element F homologs. a The distribution of for all annotated genes in the B. germanica genome is shown, truncated to not include extreme values. b Boxplots show the distributions of for B. germanica with homologs on one of the six D. melanogaster Muller elements. The red dashed line indicates the expectation of =− 1 for X-linked genes. Each element F homolog is shown as a red dot on top of the box plot. The normal distributions from the mixture models for element A–E and element F homologs are shown next to the boxplots. c The percent of B. germanica genes with <− 0.5 that have D. melanogaster homologs on each of the six Muller elements is plotted. The 95% confidence intervals (CIs) of the expected percent of genes for each Muller element are shown by the error bars. Observed percentages that lie outside the CI indicate an excess or deficiency of homologs on an element with moderately female-biased coverage

