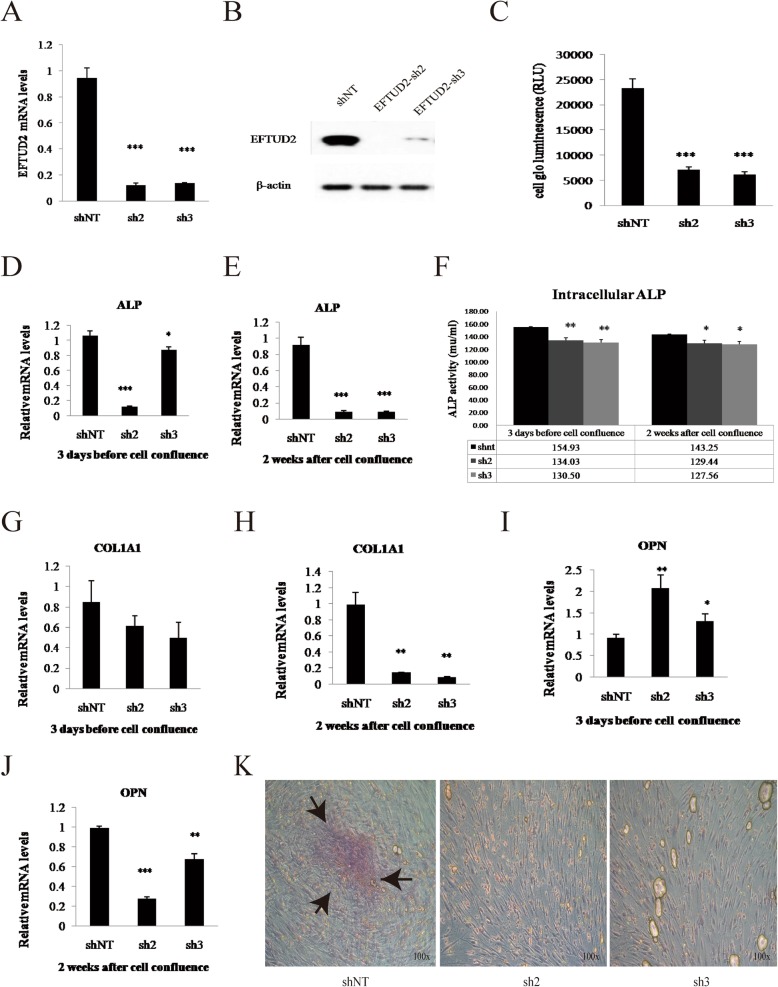
Fig. 6.
EFTUD2 gene knockdown in HCO cells. a Expression of EFTUD2 mRNA in HCO cells transfected with shNT, sh2, and sh3 lentiviruses. b Protein expression of EFTUD2 in HCO cells transfected with shNT, sh2, and sh3 lentiviruses. c Comparison of cell proliferation between HCO cells with EFTUD2 knockdown (sh2 and sh3) and the control group (shNT). d, e ALP mRNA levels in different groups (shNT, sh2, sh3) at 3 days before and 2 weeks after cell confluence in HCO cells. f Intracellular ALP activity (mu/ml) in HCO cells with EFTUD2 knockdown (sh2 and sh3) was much lower than in the control (shNT) at 3 days before cell confluence according to Student’s t test. g, h COL1A1 mRNA levels in HCO cells in different groups (shNT, sh2, sh3) at 3 days before and 2 weeks after cell confluence. i, j OPN mRNA levels in different groups (shNT, sh2, sh3) of HCO cells during development. k Alizarin red staining of HCO cells in these 3 groups at 3 days after cell confluence. Black arrows indicate calcific nodules (*P < 0.05; **P < 0.01; and ***P < 0.001; Student’s t test)

