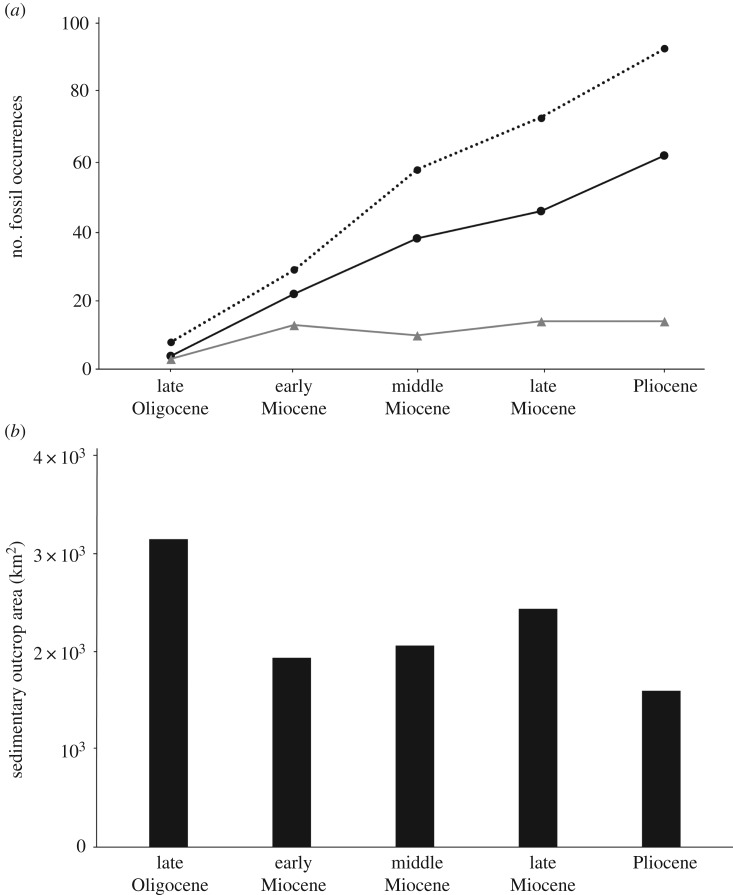
Figure 3.
(a) Number of pinniped occurrences from the eastern and western coasts of the USA through geological time. Dashed line represents the number of fossil occurrences including an assortment of taxonomic ranks. Black line represents the number of fossil occurrences identified at the level of species. Grey line represents the species richness of pinnipeds. (b) Rock outcrop area for North American marine rock units, using unpublished data collected for the analyses published in Uhen & Pyenson [10].

