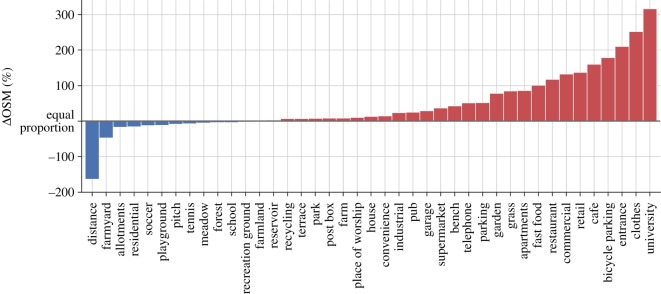
Figure 4.
The average high-volume trip is a short-distance trip between urban areas. In this plot, the length of every bar shows the relative difference between a trip attribute (travel distance, or the density of an OSM tag at the destination ward) when averaged over the 2% trips with the highest volume, versus the same attribute when averaged over the other 98% of trips. Trip attributes which are more frequent for the 2% high-volume trips are shown in red, whereas trip attributes more frequent for the other 98% of trips are shown in blue. For example, the density of points of interest tagged as fast food or restaurant is approximately 100% higher for high-volume trips, while the average travel distance is 150% higher for the other group. All attributes shown in the plot vary at least 1% between both groups.

