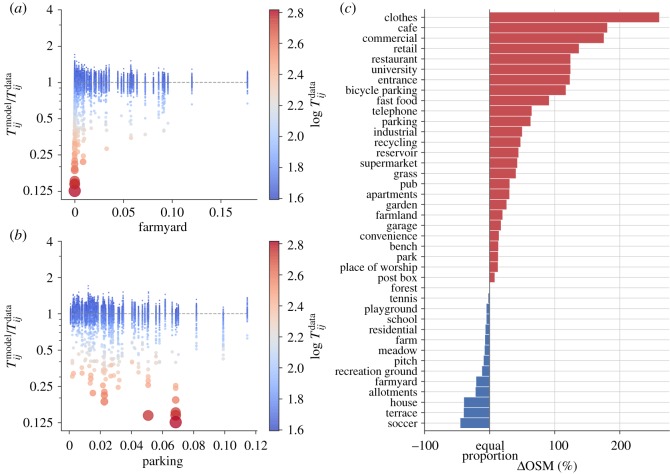
Figure 5.
High-volume urban trips are underestimated by human mobility models. (a,b) Scatter plots for the ratio against the density of the OSM tags farmyard and parking in the destination ward, respectively. The ratio indicates the overestimation error for the model class with the best performance, namely the gravity model with power functions on the travel cost and parameters fit to the data. Dot size and colour indicate the magnitude of the real trip volume (), with small blue dots for low volumes and large red dots for large volumes. The bar plot in (c) shows the difference between the trip attributes of the 2% trips with the lowest overestimation ratio when compared with the other 98% of trips. For example, the density of POIs tagged as cafe is nearly 200% higher for the underestimated trips, while the density of points POIs tagged as soccer is approximately 50% higher for the non-overestimated trips.

