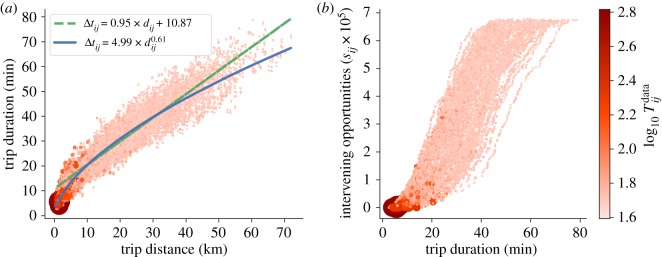
Figure 6.
Scaling between different metrics for travel distance. (a) How trip duration measured in minutes and travel distance measured in kilometres scale in an almost linear fashion. (b) Trip duration on the x-axis, and intervening opportunities (sij) on the y-axis. The plot shows a clear positive correlation between both variables (r = 0.86, p < 10−16). In both panels, smaller lighter dots indicate trips with a lower trip volume, while larger darker dots indicate higher trip volumes.

