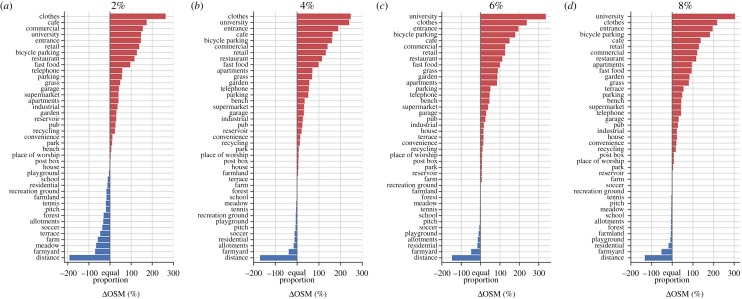
Figure 8.
The high-volume split is robust to the cut-off threshold. (a–d) Bar plots similar to figure 4, but for different cut-offs, ranging from 2% to 8%. They show no meaningful variation in the properties of the high-volume trips and the properties of all other trips in terms of OpenStreetMap points of interest. In all cases, high-volume trips are on average over shorter distances and to more urban areas.

