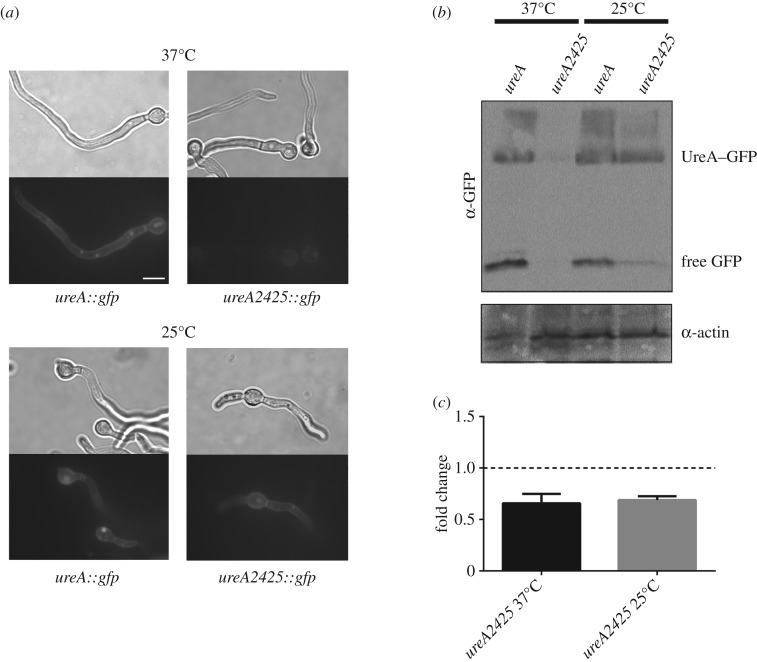
Figure 4.
Expression of UreA2425-GFP. (a) Light microscope and epifluorescence images of mutant bearing the ureA2425 mutation grown in derepressing conditions at 25 and 37°C. wt UreA–GFP localization is shown as a control. Scale bar, 10 µm. (b) Western blot analysis of total protein extracts of ureA2425–GFP mutants. Cultures were grown for 14–16 h at 25°C and 37°C in derepressing conditions (proline as a sole nitrogen source). Membranes were incubated with anti-GFP antibody (upper panel); the low mobility band corresponds to intact UreA–GFP, and the high mobility band corresponds to free GFP. Membranes were stripped and reincubated with anti-actin antibody (lower panel), as control of loading. Partial fields cropped from blots are shown; full-length blots are presented in the electronic supplementary material, figure S1. (c) Expression analysis of ureA2425, grown in derepressing conditions at 25 and 37°C, relative to expression of ureA in a wt strain (set as 1) is shown. Fold change was calculated using actin (actA) as a reference gene. The results are an average of three biological replicates, and error bars represent standard deviations.

