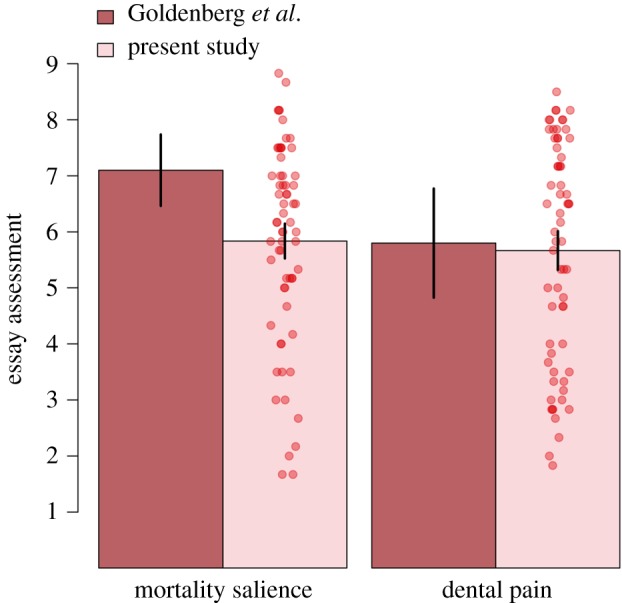
Figure 2.

Results of the present study. Each red point represents the average essay evaluation from an individual participant. The darker bars summarize the results of the original study by Goldenberg et al. ([9], Study 2), whereas the lighter bars summarize the results of the present study. Error bars denote 95% confidence intervals.
