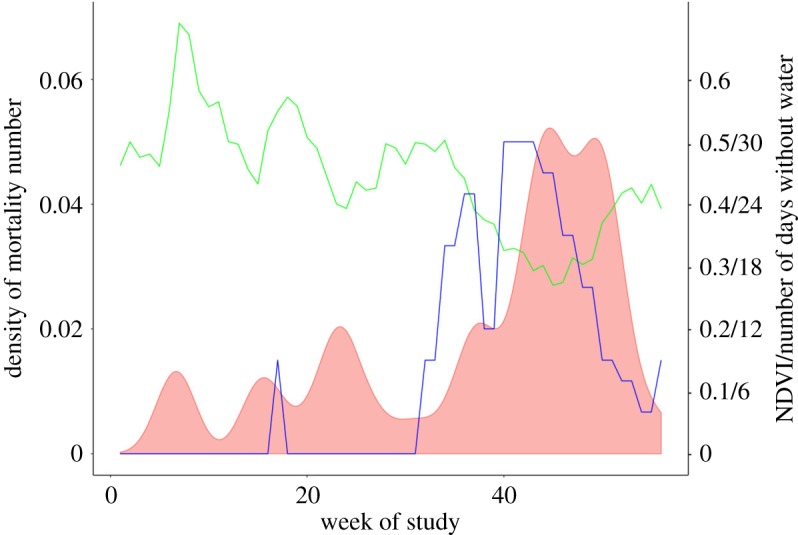
Figure 4.

The relationship of food availability (NDVI, green line), days without water (the number of the previous 30 days water was unavailable, blue line) and the number of mortalities during the study period (model 3; density plot, red shaded area, N = 46 deaths). NDVI and mortality rate are calculated twice per month, which is given on the x-axis (N = 56 periods, 0 = Jan 2015, 56 = July 2017).
