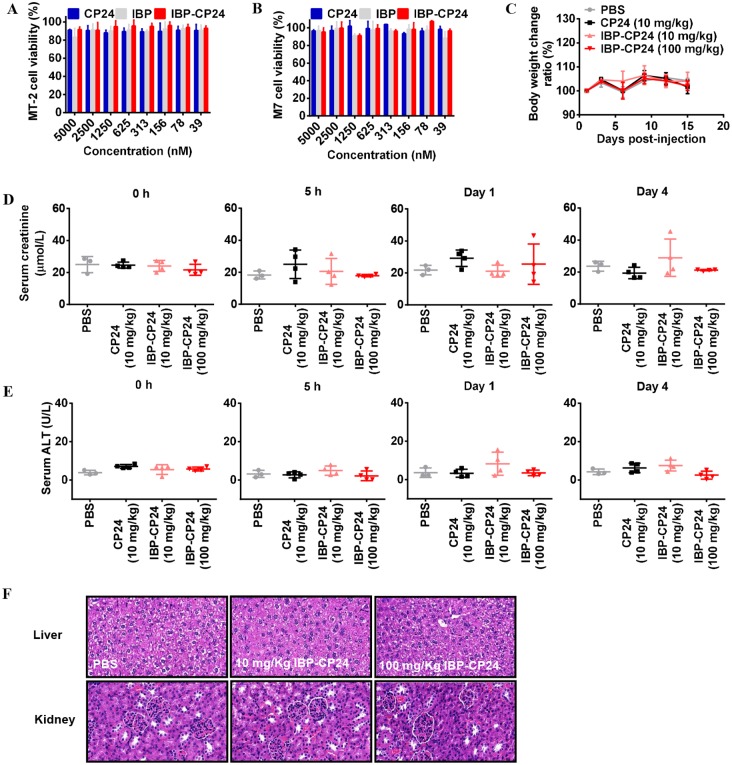
Fig 4. Evaluation of in vitro and in vivo toxicity of IBP-CP24.
(A and B) Cytotoxicity of CP24, IBP and IBP-CP24 to MT-2 (A) and M7 (B) cells. Each sample was tested in triplicate and the data are presented as mean ± SD. (C) Body weight changes were recorded at the indicated time points in mice treated with PBS, 10 mg/kg CP24, 10 mg/kg IBP-CP24 or 100 mg/kg IBP-CP24. Each time point is represented by mean ± SD. (D) The creatinine in mice sera was measured by using a creatinine assay kit at different time points. Error bars indicate standard deviations. (E) ALT activity in the sera of mice was measured with an ALT assay kit. Error bars indicate standard deviations. (F) H&E staining analysis of livers and kidneys in treated mice at day 15 post-injection.

