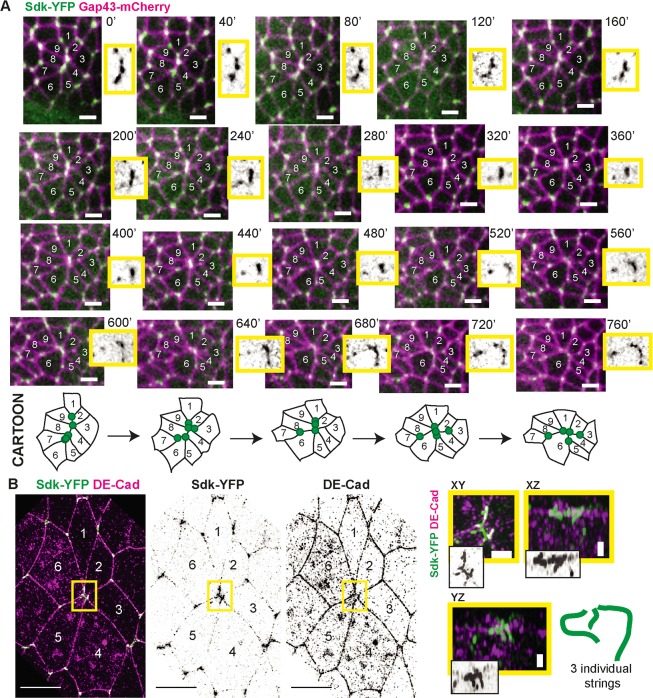
Fig 3. tAJs marked by Sdk-YFP are separate at rosette centres.
(A) Sdk localisation during rosette formation imaged over 15 minutes in live embryos labelled with Sdk-YFP and Gap43-mCherry. Time is indicated in seconds since start of the intercalation rosette. Each image is a maximum intensity projection over 3 z-slices spanning 1.5 μm. Movie is representative of behaviour found in all of n = 6 full rosette-like intercalation events. Scale bars = 5 μm. Close-up images of the rosette centre are shown in yellow boxes for the Sdk-YFP channel. Cartoon below illustrates the dynamics of the Sdk-YFP puncta seen in the movie. (B) Sdk-YFP string localisation at a rosette centre involving six cells, imaged by super-resolution SIM. The image is from a stage 8 embryo fixed and stained for GFP and DE-Cad. Maximum projection over 12 slices = 1.5 μm. Close-ups of the rosette centre with different projections are shown in yellow boxes to demonstrate that three distinct strings can be resolved. Cartoon shown to interpret images. Scale bars for the main SIM panels are 5 μm and for the close-ups 1 μm. DE-Cad, DE-Cadherin; Gap43, growth-associated protein 43; GFP, green fluorescent protein; Sdk, Sidekick; SIM, Structured Illumination Microscopy; tAJ, tricellular adherens junction; YFP, yellow fluorescent protein.

