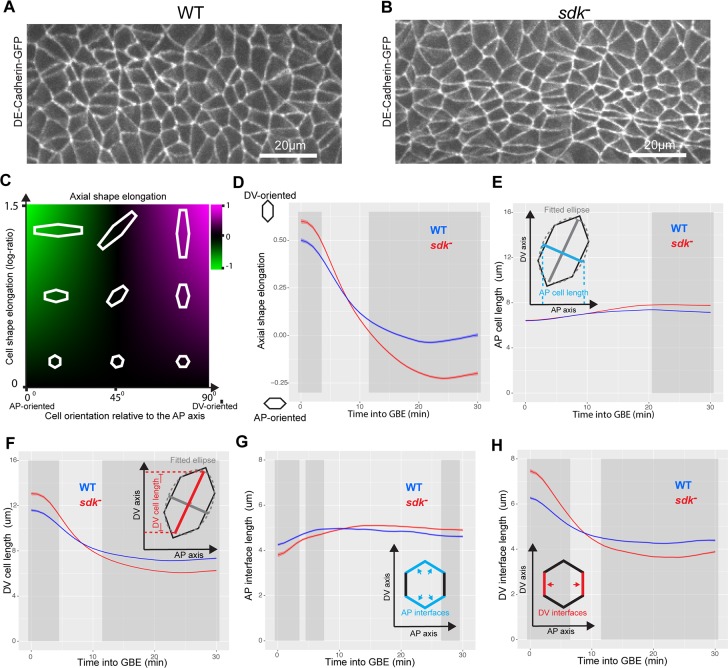
Fig 4. Cell shapes are more anisotropic in sdk mutants versus the WT during GBE.
(A,B) Movie frame of ventral ectoderm at 30 mins into GBE from representative WT (A) and sdk (B) movies, labelled with E-cadherin-GFP. (C,D) Measurement of cell shape anisotropy and orientation (see also S5A–S5C Fig). Cell shape anisotropy is calculated as the log ratio of the principal axes of best-fit ellipses to tracked cell contours. An isotropic cell shape (a circle) will have a log-ratio value of 0 and a very elongated cell a value of over 1. Cell orientation is given by the cosine of the angular difference between the ellipse’s major axis and the DV embryonic axis. Negative values indicate cells that are elongated in the AP axis, positive values in the DV axis. Cell shape anisotropy and orientation measures are then multiplied together to give a composite measure (termed ‘axial shape elongation’) of how elongated cells are in the orientation of the embryonic axes (Materials and Methods). (D) Axial shape elongation measure (y-axis) for the first 30 mins of GBE (x-axis) for WT and sdk embryos. In this graph and hereafter, the ribbon’s width indicates the within-embryo confidence interval, and the dark grey shading indicates a difference (p < 0.05) (Materials and Methods). (E–F) Measures of AP and DV cell lengths in WT and sdk embryos (see also S5D and S5E Fig). Cell shape ellipses are projected onto AP and DV axes to derive a measure of cell length in each axis. (G,H) Evolution of AP-oriented and DV-oriented cell–cell interface lengths (y-axis) as a function of time in GBE (x-axis) (see also S5F and S5I Fig). Tracked cell–cell interfaces are classified as AP- or DV-oriented according to their orientation relative to the embryo axes. Data for graphs D–H can be found at https://doi.org/10.17863/CAM.44798. AP, anteroposterior; DV, dorsoventral; GBE, germband extension; GFP, green fluorescent protein; Sdk, Sidekick; WT, wild type.

