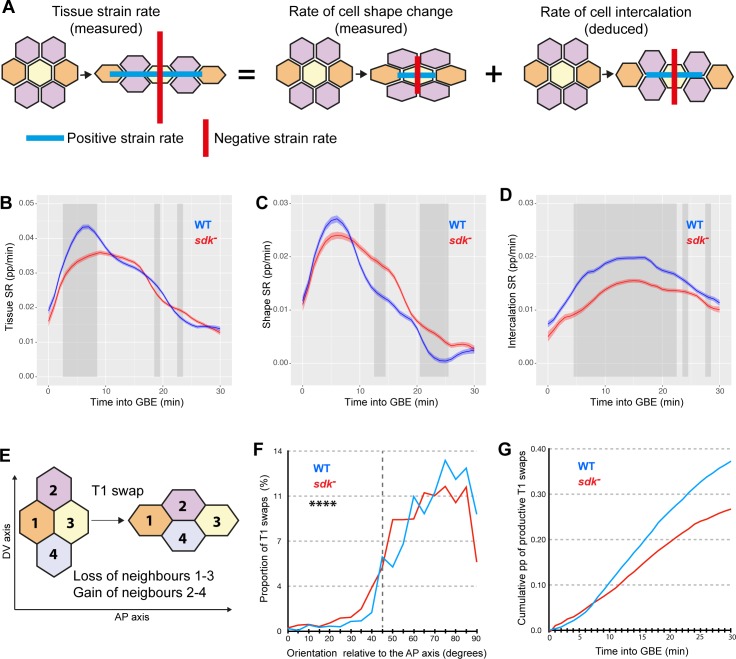
Fig 6. Sdk is required for normal polarised cell intercalation.
(A) Graphical illustration of our measures of tissue and cell shape SRs (Materials and Methods). The cell intercalation SR is derived from these two measures. (B–D) Average SRs in the direction of extension (along AP) for five WT (blue) and five sdk mutant (red) embryos for the first 30 minutes of GBE. Total tissue SR (B), cell shape SR (C), and cell intercalation SR (D). Units are in pp per minute. (E) Diagram of a T1 transition leading to a loss of neighbours 1 and 3 along AP and a gain of neighbours 2 and 4 along DV. (F,G) Analysis of the number and orientation of T1 transitions averaged for five WT (blue) and five sdk mutant (red) embryos for the first 30 minutes of GBE (see also S8D and S8E Fig). (F) Orientation of all T1 transitions relative to the AP embryonic axis. Orientation is given by the angle of cell interfaces relative to AP, 5 minutes before a T1 swap (Kolmogorov–Smirnov test, N = 1,786 for WT and 1,890 for sdk mutant, D = 0.1115, p < 0.0001). (G) Cumulative proportion of T1 swaps contributing to axis extension in AP (called productive T1 swaps; see Materials and Methods) for the first 30 minutes of GBE and expressed as a pp of DV-oriented interfaces tracked at each time point. Data for graphs B–G can be found at https://doi.org/10.17863/CAM.44798. AP, anteroposterior; DV, dorsoventral; GBE, germband extension; pp, proportion; Sdk, Sidekick; SR, strain rate; WT, wild type.

