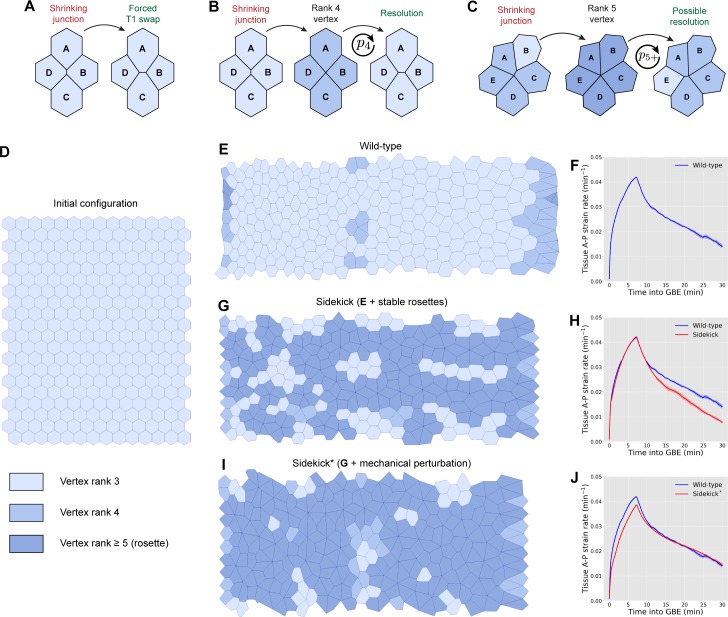
Fig 7. Vertex models of the sdk mutant phenotype.
(A) Cell rearrangement (T1 transition) is usually implemented in vertex models as follows: edges with length below a threshold are removed, and a new edge is created between previously non-neighbouring cells. (B–C) Alternative implementation of cell rearrangement used in this paper. (B) Shortening junctions merge to form a four-way vertex and a protorosette, which has a probability, p4, of resolving at every time step. (C) Formation of rosettes around higher-order vertices (formed of five cells, as shown here, or more) due to the shortening of junctions connected to four-way vertices. Edges connected to the shortening junction are merged into the existing vertex, which now has a probability, p5+, of resolving at every time step. (D) Initial configuration for each simulation. The tissue is a tiling of 14 × 20 regular hexagons with periodic boundary conditions. All cells are bestowed one of four stripe identities, {S1, S2, S2, S4}, representing identities within parasegments, as in [49] (see S9A Fig for an illustration). (E) Wild-type simulation of Drosophila GBE in the presence of a posterior pulling force, implementing cell rearrangements as outlined in B and C with and . Model parameters used were (Λ, Γ) = (0.05, 0.04). (F) Tissue strain rate in the A–P (extension) direction for wild-type tissues with parameters used in E. Solid line and shading represent mean and 95% confidence intervals from five independent simulations. (G) Simulation of GBE in a tissue in which T1 swaps are less likely to resolve, with and . All other parameters are kept equivalent to wild-type simulation. (H) Tissue strain rate in the A–P (extension) direction for tissues with parameters used in G compared to strain rate of wild-type tissue in E. Solid line and shading represent mean and 95% confidence intervals from five independent simulations. (I) Simulation of GBE in a tissue in which T1 swaps are less likely to resolve, with and , as in G, and additionally in which the shear modulus of the tissue (in the absence of actomyosin cables) has been reduced by setting Γ = 0.01. All other parameters are kept equivalent to wild-type simulation. (J) Tissue strain rate in the A–P (extension) direction for tissues with parameters used in I compared to strain rate of wild-type tissue in E. Solid line and shading represent mean and 95% confidence intervals from five independent simulations. As shown in key, for B, C, E, G, and I, cell colouring indicates the vertex rank of a cell, defined as the maximum number of cells sharing one of its vertices (note that darker blue is for rosettes of rank 5 and above). Further details about models and simulations can be found in S1 Text. Data for graphs F, H, and J can be found at https://doi.org/10.17863/CAM.44798. A–P, anterior–posterior; GBE, germband extension; Sdk, Sidekick.

