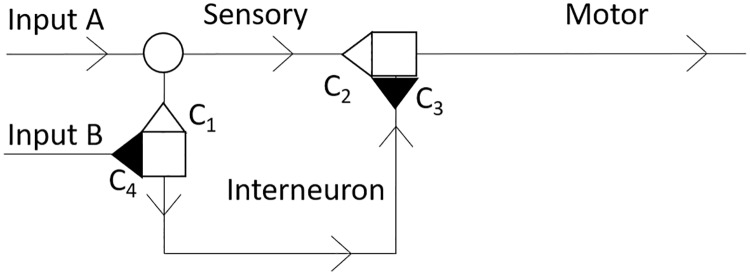
Fig 1. Schematic diagram which illustrates the composition of the RDMU with two stimulating inputs A and B.
Excitatory synapses C1 and C2 are shown as empty triangles. Inhibitory synapses C3 and C4 are represented by filled-in triangles. Synaptic junctions are denoted by empty squares and the neuronal branching point is marked with an empty circle. Arrows represent the direction of propagation of transmembrane potentials. The portion of the RDMU between C1 and C3 is the interneuron.

