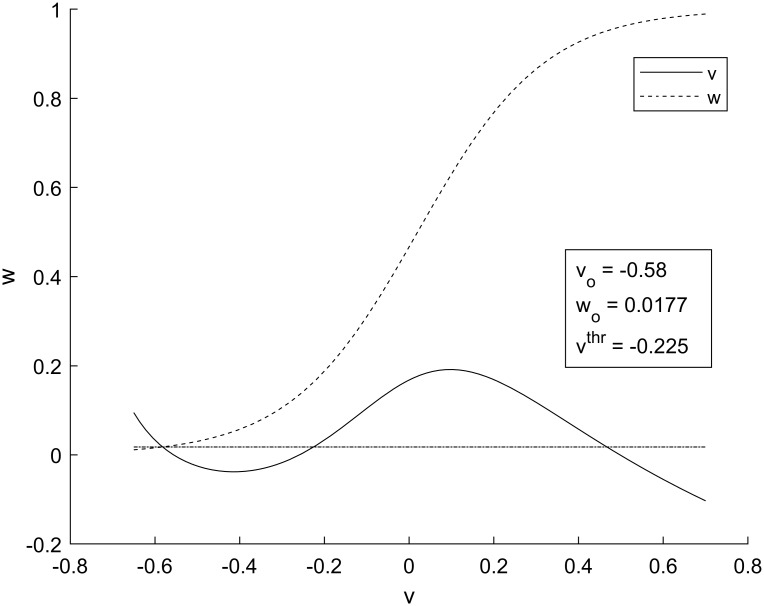
Fig 3. Phase portrait for the Morris-Lecar model.
The solid line is the null-cline for v and the dashed line is the null-cline for w. The equilibrium values for v and w occur at the intersection of null-clines. The horizontal dot-dashed line has a value of wo for all v, and is used to find vthr, which is the second intersection of v and wo.

