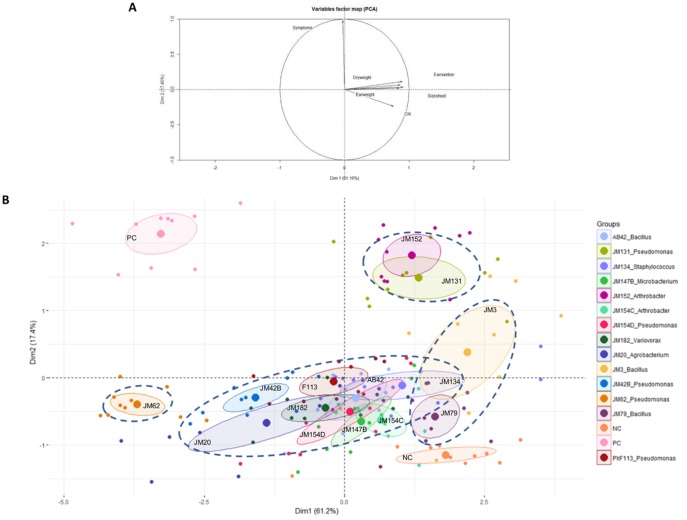
Fig 5. Discriminant principal component analysis (PCA) of plant growth and disease symptom parameters of wheat plants inoculated with each of the 14 bacterial strains in presence of F. graminearum Fg1.
(A) Correlation circle between recorded plant parameters. (B) PCA (first two axes) showing groups of strains (dashed line circles) inducing similar responses on plants. NC: negative control (un-inoculated wheat plants). PC: positive control (wheat plants inoculated with Fg1 only).

