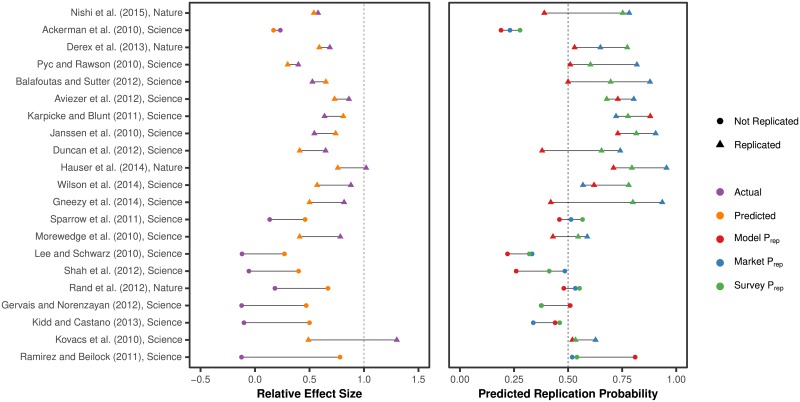
Fig 5. Predicted and actual results of the SSRP.
Model predictions were registered before the experiments had been conducted. The left panel shows predicted relative effect size in purple and actual in orange, sorted by increasing prediction error. Right panel shows replication probability as predicted by the model, a prediction market, and a survey respectively. Data points are represented by a triangle when the replication was successful (p < 0.05 and an effect in the same direction). To see when the model made a correct prediction at the 50% probability threshold study the right panel. Red triangles on the right side of the dashed line and circles on the left side have been predicted correctly.

