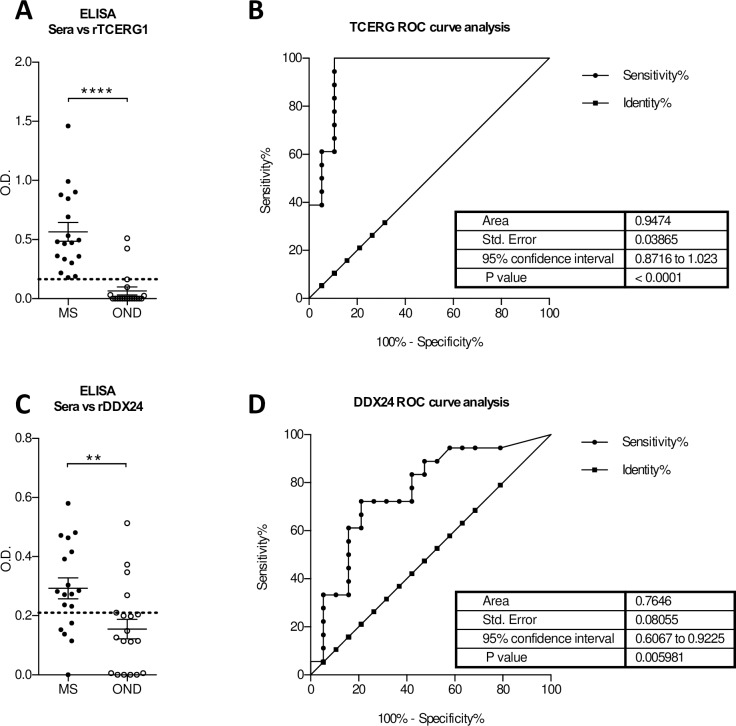
Fig 4. Evaluation of the diagnostic value of DDX24 and TCERG1 in the prediction of MS.
Serum response against recombinant TCERG1 (A) and DDX24 (C) in MS (n = 18) and OND (n = 19) patients (cohort 3, Table 1) measured by ELISA. ROC analysis of TCERG1 (B) and DDX24 (D) to distinguish MS from OND patients. Dotted lines represent the cut-off with the highest Youden’s index. Unpaired t-test has been used in A and C; ** p < 0.01, *** p < 0.001, **** p< 0.0001.

