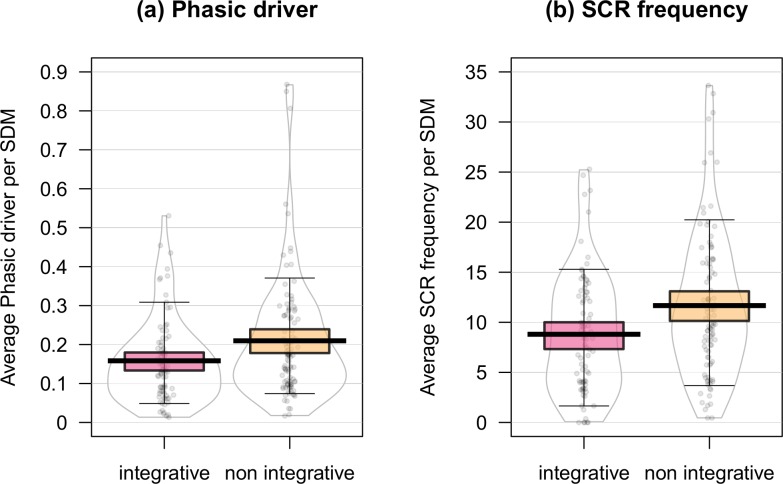
Fig 1. Comparisons of physiological responses in integrated and non-integrated SDM.
Pirateplot (median, interquartile and data spread) (Yarrr, 0.1.5 package,[47]) of phasic driver (a) and SCR frequency (b) within integrative and non-integrative SDM. The units of measurement are μS for the phasic driver dependent variable and the average number of skin conductance responses per minute for the SCR frequency dependent variable.

