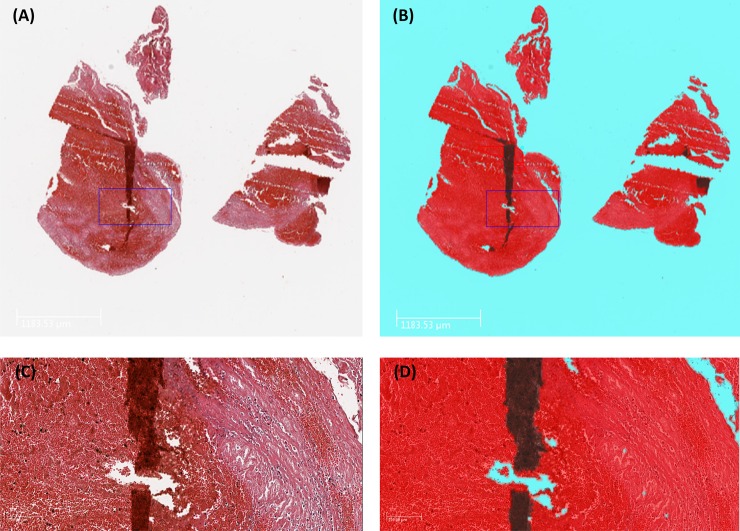
Fig 1. Background and artefact detection.
(A&C) Histopathological staining of an AIS clot with H&E stain, (1X & 10X respectively). A fold is clearly visible on the tissue. (B&D) Output image from Orbit Image Analysis software following the use of an Exclusion model. Background, artefact and tissue are depicted in blue, black and red respectively. Orbit Image Analysis correctly identifies and excludes the folds on the tissue (black).

