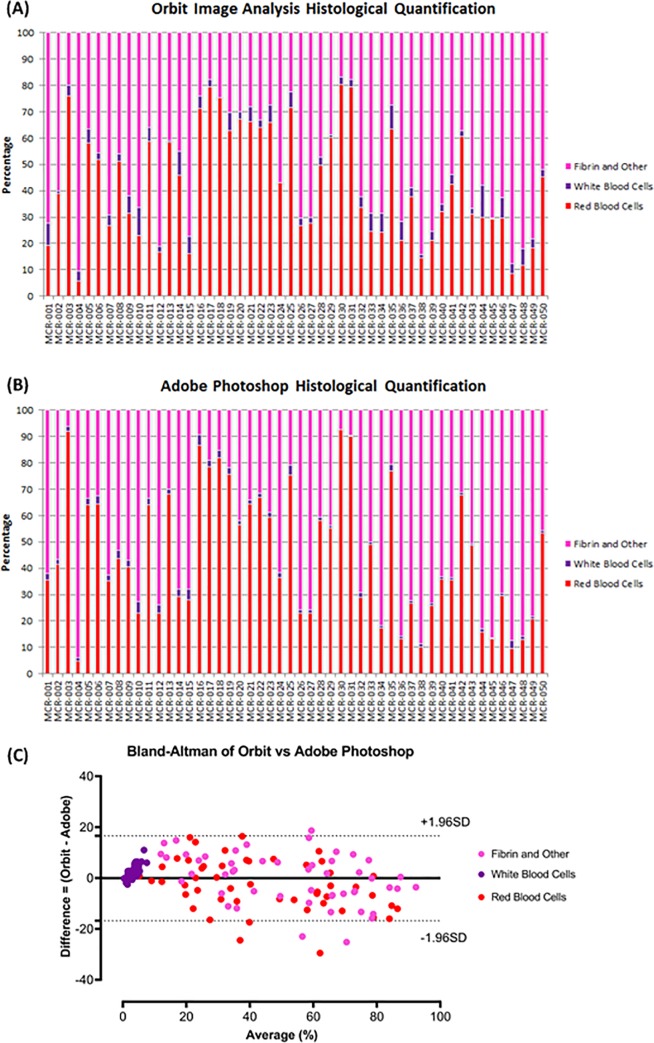
Fig 3. Quantified histological clot composition.
Graphical representation of the histological composition of 50 AIS clots following quantification using Orbit Image Analysis software (A) and Adobe Photoshop Software (B). The results from both Orbit Image Analysis and Adobe Photoshop are similar for each patient in the study. (C) The Bland-Altman plot demonstrated that there was good agreement between Orbit Image Analysis and Adobe Photoshop, the bias was -0.01±8.51 (Mean±SD) and the limits of agreement were -16.8 to 16.6. Red = Red Blood Cells, Purple = White Blood Cells and Pink = Fibrin as per the H&E stain.

