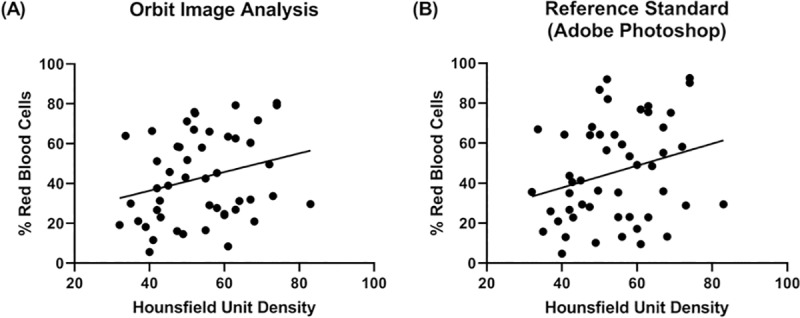
Fig 4. Red blood cell composition versus Hounsfield Units.

Corresponding % Red Blood Cell composition versus Mean Hounsfield Unit when measured by (A) Orbit Image Analysis and (B) Adobe Photoshop. Mean Hounsfield Unit values are taken from the non-contrast CT scans performed prior to endovascular treatment for each of the 50 clots. As the trend lines suggest, there is a significant positive correlation between the percentage of Red Blood Cells and Mean Hounsfield Unit Densities on non-contrast CT scans when measured using the Orbit Image Analysis software (ρ = 0.291*, p = 0.040*) and Adobe Photoshop (ρ = 0.280*, p = 0.049*).
