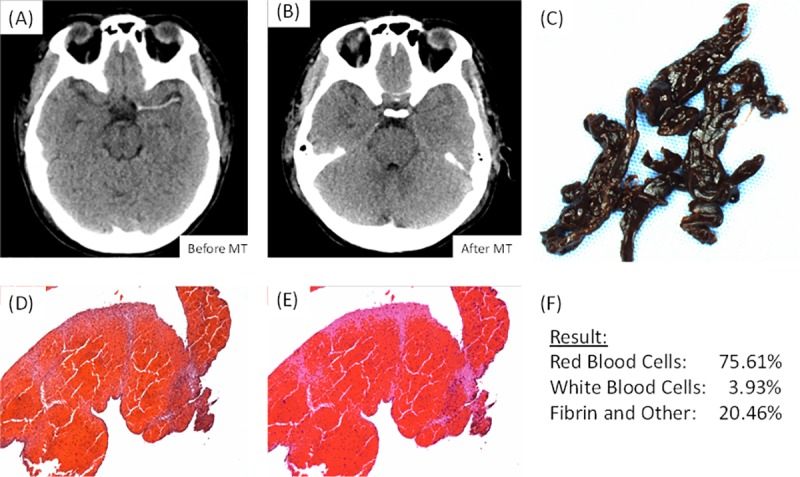
Fig 5. Patient example.

This is an example of a patient who presented at Mayo Clinic, Rochester, with a clot in the M1 segment of their Left Middle Cerebral Artery. (A) Is an image taken from the non-contrast CT scan of the patient prior to the procedure demonstrating the presence of the clot (B) Is an image taken from the non-contrast CT scan of the patient after the procedure demonstrating successful removal of the clot (C) Is a gross photo of the clot that was removed (1.25x). (D) Is a high-powered image (100x) of the corresponding (H&E) stained slide. (E) Is an image of the output from the Orbit software following quantification of the H&E stained slide. (F) Is the results of the histological quantification.
