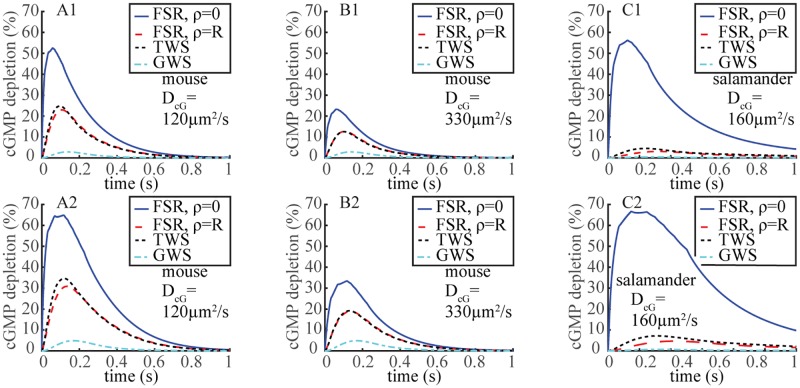
Fig 2. Spatial inhomogeneity of cGMP depletion across the activated disc during the SPR revealed by the FSR model.
Time dynamics of relative [cGMP](ρ, θ, z, t) depletion, as defined in Eq 16, at the activation site ρ = 0 and on the rim ρ = R, for . For these simulations deactivation of R* was deterministic with lifetime τav = 0.11 s (A1, B1) or 2τav = 0.22 s (A2, B2) for mouse and τav = 0.625 s (C1) or 2τav = 1.25 s (C2) for salamander.

