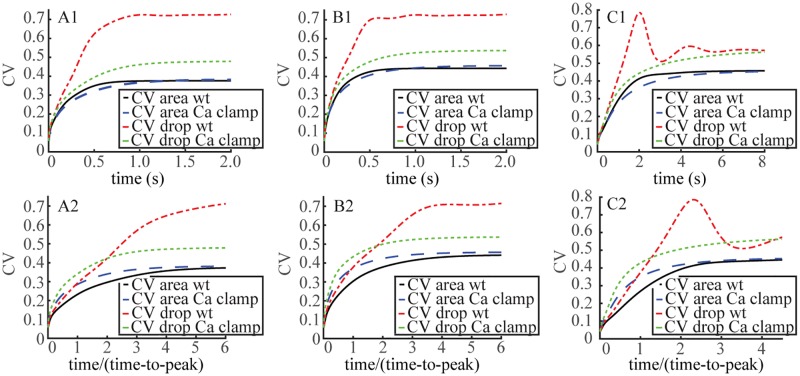
Fig 6. Crossing of variability curves revealed by viewing the WT and Ca2+ clamped SPR on their intrinsic time scales.
Time dynamics of CV(Iint(⋅)), CV[I(⋅)] for WT, (black, red traces) and Ca2+ clamped conditions (dashed blue, green traces) for mouse (A1,B1,A2,B2) and salamander (C1,C2). DcG was set to 120 μm2/s (A1, A2) or to 330 μm2/s (B1, B2). The functionals Iint(t) and I(t) are defined in Eqs 3, 4 and 5. In all cases the FSR model was in force. Upper Panels A1, B1, C1: Time dynamics of t → CV(Iint(t)) (CV-area), t → CV[I(t)] (CV-drop) in absolute times t in s. Lower Panels, A2, B2, C2: Time dynamics of τ → CV(Iint(τ)) (CV-area), τ → CV[I(τ)] in relative rescaled times τ = t/tpeak, so that τ = 1 corresponds, in each case, to the amplitude of the SPR.

