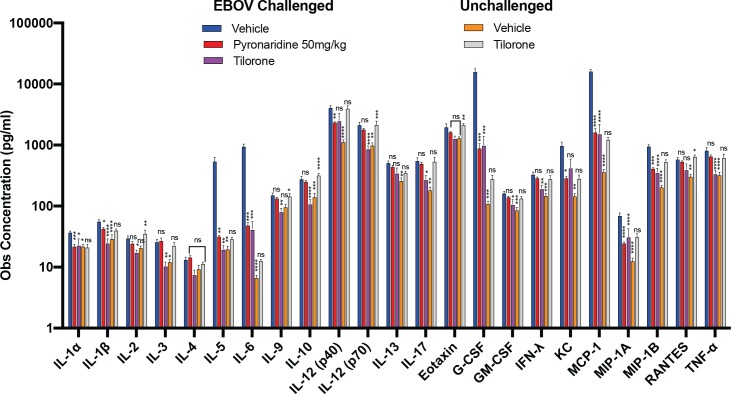
Fig 6. The observed concentration of each cytokine/chemokine was from either challenged (EBOV) or unchallenged (UN) mice, with the serum from each euthanized mouse run in duplicate.
Each challenged vehicle (EBOV) and tilorone (EBOV) group is comprised of 6 mice and the unchallenged, vehicle and tilorone groups each had 4 mice each. Each bar represent the mean of the group with error bars representing the SEM. The statistical significance (0.0021< * ≤ 0.0332, 0.0002< ** ≤ 0.0021, 0.0002< *** ≤ 0.0001, **** < 0.0001) of the difference between the EBOV challenged vehicle group (negative control) and the test or control article (pyronaridine or tilorone) groups is displayed above each bar. The identifier is centered on its respective treated group. Significance was determined by using a Tukey or Dunnett’s T3 test.

