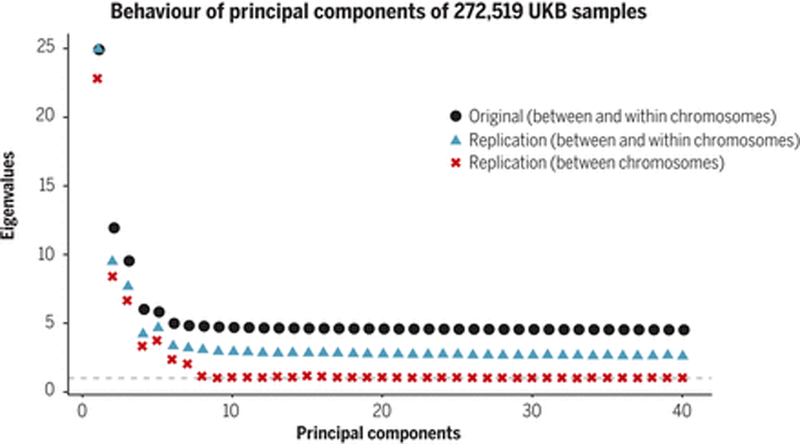
Figure 3. Behavior of principal components of 272,519 UK Biobank samples.
We examine the degree to which principal components are capturing real population structure by examining whether the genetic variance (eigenvalues) explained by top 40 principal components inferred from 146,082 SNPs in 272,519 UK Biobank White British (WB) samples replicates in an independent sample of WB. A replication eigenvalue above 1 indicates that the inferred principal component is capturing replicable correlations between SNPs, either local-LD (within chromosome) or population structure (mostly between chromosomes). Original (black squares): eigenvalues of the principal components in the original set of 272,519 WB individuals. Replication (blue triangles): eigenvalue-equivalents, i.e. variances of the linear combinations of SNP using weights inferred from the original set and standardized genotypes in the replication set of 64,969 WB individuals. Replication (between chromosome only) (red crosses): using the same replication set, but eigenvalue-equivalents computed by ignoring the covariances of SNP-pairs within the same chromosomes, and counting only the covariances of SNP-pairs on different chromosomes, which includes 94.8% of all SNP-pairs. The average eigenvalue for the last 32 PCs decreases from 4.37 for the original set to 2.61 for the replication set and further to 1.03 for the between chromosome set, indicating those PCs are mostly capturing noise and local-LD rather than population structure.

