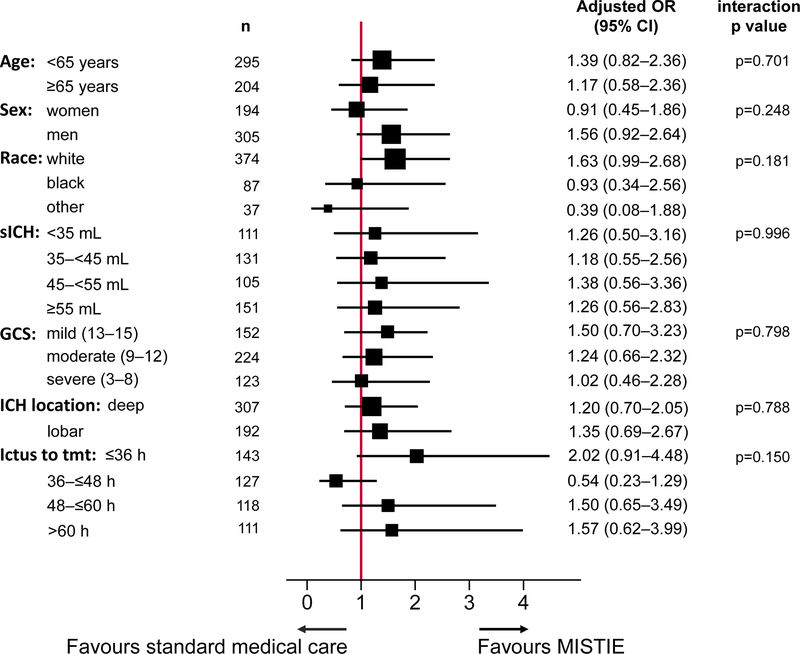
Figure 4: Subgroup analyses.
Forest plot of interaction terms, adjusted for age, sex, race, intracerebral haemorrhage location, intracerebral haemorrhage stability, time from stroke to treatment initiation, and GCS score (mild, moderate, severe) at presentation. The test for homogeneity of treatment effect (based on testing for interaction) was not rejected at α level 0·05. The size of points indicates the relative sizes of the subgroups. GCS scores range from 15 (fully conscious) to 3 (deep coma). sICH=stability intracerebral haemorrhage. GCS=Glasgow Coma Scale.

