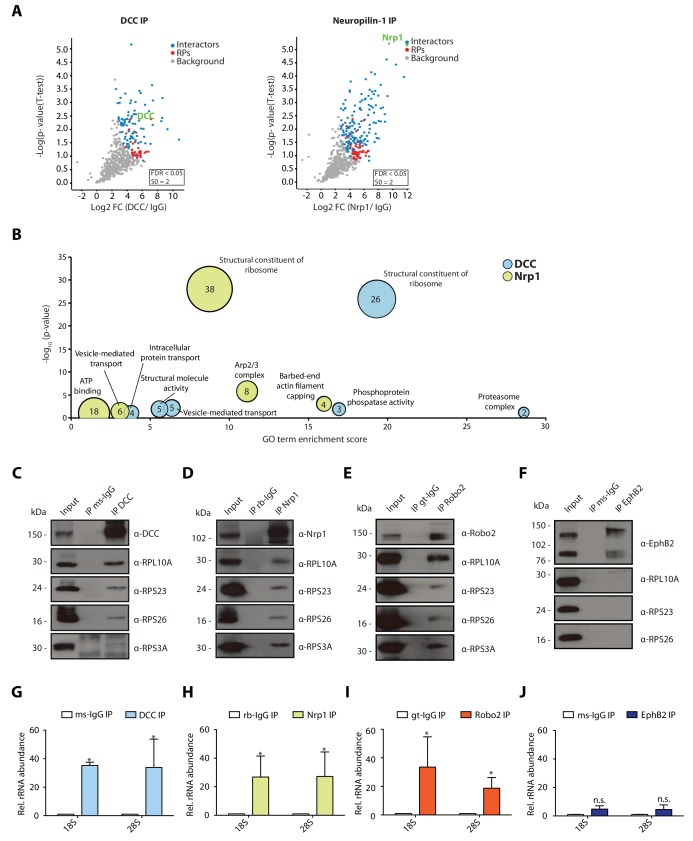
Figure 1. Multiple guidance cue receptors interact with ribosomes.
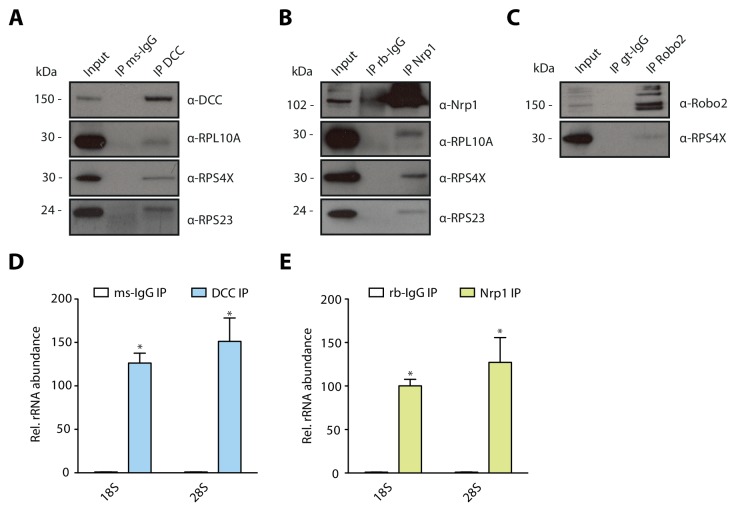
(A) Volcano plots showing statistically enriched proteins in DCC-IP and Nrp1-IP samples identified by permutation-based FDR-corrected t-test based on three biological replicates. The LFQ intensity of the DCC or Nrp1 pulldowns over IgG pulldowns are plotted against the -log10 p-value. FDR < 0.05; S0 = 2. (B) Gene enrichment analysis of statistically enriched proteins in the DCC and Nrp1 pulldown samples. The values in each circle denotes protein count. (C–F) Western blot validation of RP co-immunoprecipitation with DCC, Nrp1 and Robo2 but not with EphB2. Each Western blot was repeated 2 to 4 times, representative images are shown. (G–J) Relative 18S and 28S ribosomal RNA abundance after control (IgG) pulldown or receptors pulldowns shows enrichment of rRNA in DCC, Nrp1, and Robo2 but not EphB2 pulldowns (unpaired two-tailed t-test; three biological replicates). Bars indicate means, error bars indicate standard deviation; *p<0.05.


