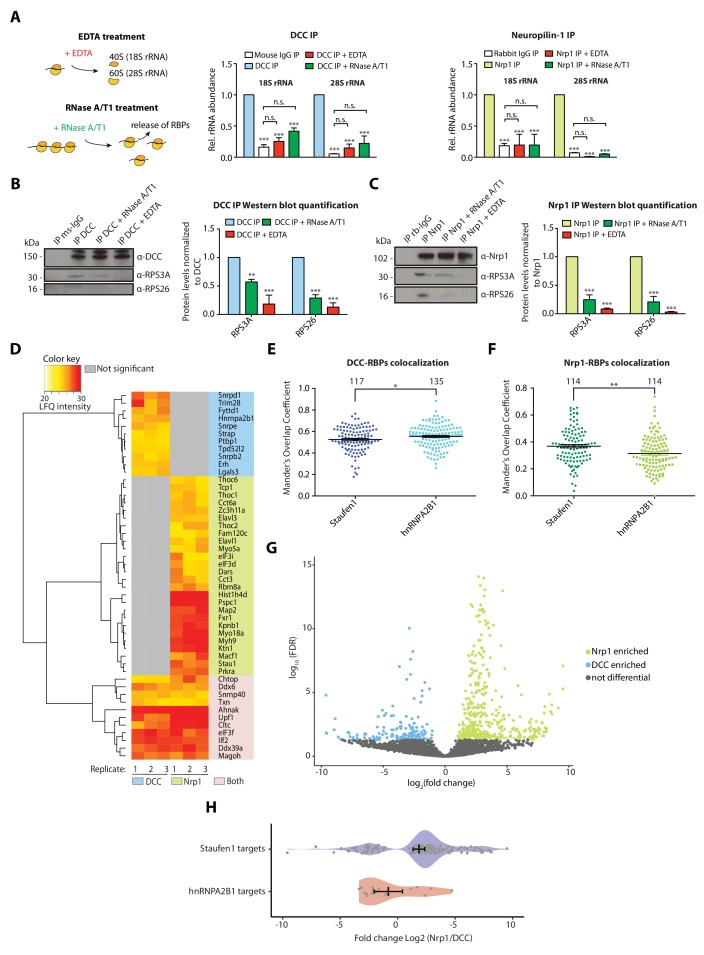
Figure 2. Receptor-ribosome coupling is mRNA dependent and DCC and Nrp1 bind to specific RBPs and mRNAs.
(A) Relative 18S and 28S ribosomal RNA abundance after control (IgG) pulldown or receptors pulldowns with or without EDTA or RNase A/T1 treatments (two-way ANOVA with Bonferroni’s multiple comparisons test; three biological replicates; Bars indicate mean, error bars indicate standard deviation; ***p<0.0001). (B) Western blot analysis and quantification of ribosomal proteins after DCC and (C) Nrp1 pulldowns. (two-way ANOVA with Bonferroni’s multiple comparisons test; three biological replicates; Bars indicate mean, error bars indicate standard deviation; **p<0.01; ***p<0.0001). (D) Hierarchically-clustered heatmap of detected RBPs after DCC and Nrp1 pulldown. LFQ intensities are plotted for each IP-MS replicate. (E) Mander’s overlap coefficients analysed using dual immunohistochemistry of DCC and Staufen1 or hnRNPA2B1 in axonal growth cones (unpaired two-tailed t-test; three biological replicates; individual data points are shown, error bars indicate SEM; p=0.03913). (F) Mander’s overlap coefficients analysed using dual immunohistochemistry Nrp1 and Staufen1 or hnRNPA2B1 in axonal growth cones (unpaired two-tailed t-test; three biological replicates; individual data points are shown, error bars indicate SEM; p=0.00161). (G) Volcano plot showing differential expression analysis for DCC and Nrp1 pulldowns. (H) Enrichment analysis plot of known RBP targets of Staufen1 and hnRNPA2B1 detected in RNA-sequencing data after DCC and Nrp1 pulldown (individual data points are shown, error bars indicate standard deviation, Mann-Whitney test, Wilcoxon rank sum test DCC versus Nrp1; p=0.001511).


