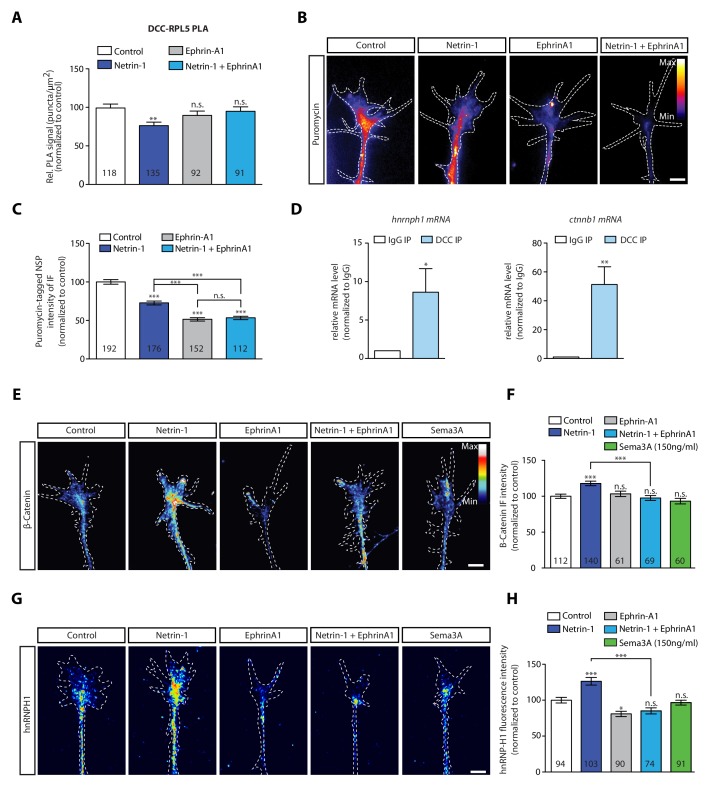
Figure 4. EphrinA1 co-stimulation blocks Netrin-1 induced receptor-ribosome dissociation and selective translation.
(A) Relative PLA quantification of DCC and RPL5/uL18 compared to control after Netrin-1, EphrinA1, or co-stimulation (one-way ANOVA with Bonferroni’s multiple comparisons test; bars indicate mean, error bars indicate SEM; **p<0.01). (B, C) Puromycin QIF relative to control after Netrin-1, EphrinA1 or co-stimulation (one-way ANOVA with Bonferroni’s multiple comparisons test; bars indicate mean, error bars indicate SEM; ***p<0.0001). (D) Relative mRNA quantification after DCC IP of hnrnph1 and ctnnb1 mRNA (unpaired t-test with Welch’s corrections on dCT values; three biological replicates; bars indicate mean, error bars indicate SEM; *p=0.02 for hnrnph1; **p=0.0018 for ctnnb1). (E, F) β-Catenin QIF relative to control after Netrin-1, EphrinA1, Sema3A or Netrin-1 and EphrinA1 co-stimulation (one-way ANOVA with Bonferroni’s multiple comparisons test; bars indicate mean, error bars indicate SEM; ***p<0.0001). (G, H) hnRNPH1 QIF relative to control after Netrin-1, EphrinA1, Sema3A or Netrin-1 and EphrinA1 co-stimulation (one-way ANOVA with Bonferroni’s multiple comparisons test; bars indicate mean, error bars indicate SEM; ***p<0.0001; *p=0.0164). Scale bars, 5 μm. For all QIF experiments, numbers in bars indicate amount of growth cones quantified collected from at least three independent experiments.


