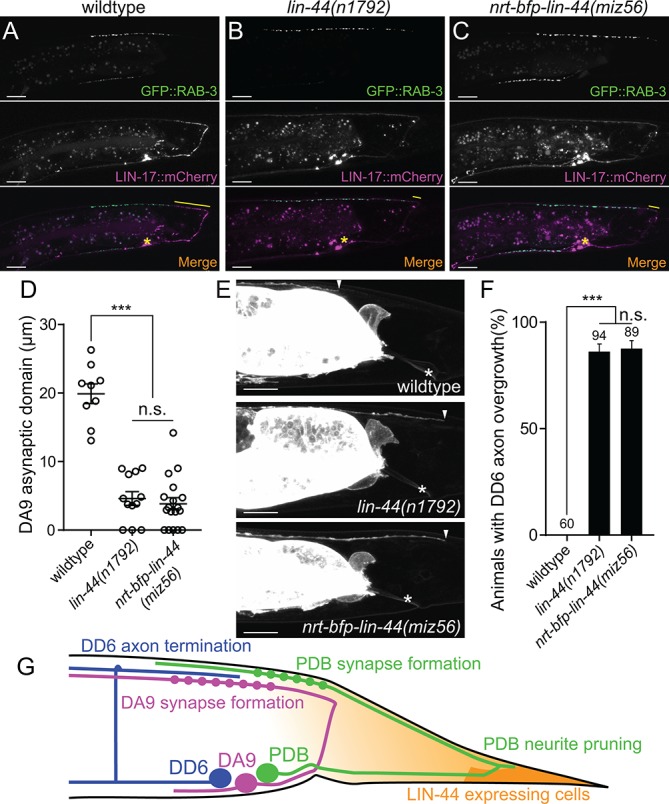
Figure 6. Membrane-tethered LIN-44 does not function as a gradient signal.
(A–C) Representative images of DA9 presynaptic specializations labeled with GFP::RAB-3 (top panels), LIN-17::mCherry localization (middle panels) and merged images (bottom panels) in N2 (A), lin-44(n1792) (B) and nrt-bfp-lin-44(miz56) (C) animals. Asterisks denote DA9 cell body, and yellow lines represent the posterior asynaptic domain of the DA9 dorsal axon. GFP::RAB-3 puncta in the ventral side of the worm is due to the expression of Pmig-13::gfp::rab-3 in the VA12 motor neuron. (D) Quantification of the DA9 asynaptic domain length. The DA9 asynaptic domain is defined by the distance between the most posterior mCherry::RAB-3 puncta and the DA9 commissure. Each dot represents an individual animal. Error bars indicate mean ± SEM. ***p<0.001; n.s., not significant (one-way ANOVA). (E) Representative image of DD6 posterior axon in wildtype (top panel), lin-44(n1792) (middle panel) and nrt-bfp-lin-44(miz56) (bottom panel). Asterisks denote the position of the rectum; arrowheads denote the end of DD6 axon. (F) Quantification of DD6 axon overgrowth defect. Animals were considered as defective if DD6 axon terminal was located posteriorly to the rectum. ***p<0.001; n.s., not significant (Chi-square test). Error bars represent standard error of proportion (SEP). (G) Schematic of the relative positions of DD6, DA9, PDB neurons and lin-44 expressing cells. Light graded orange represents hypothetical LIN-44 gradient. Scale bars: 10 μm.


