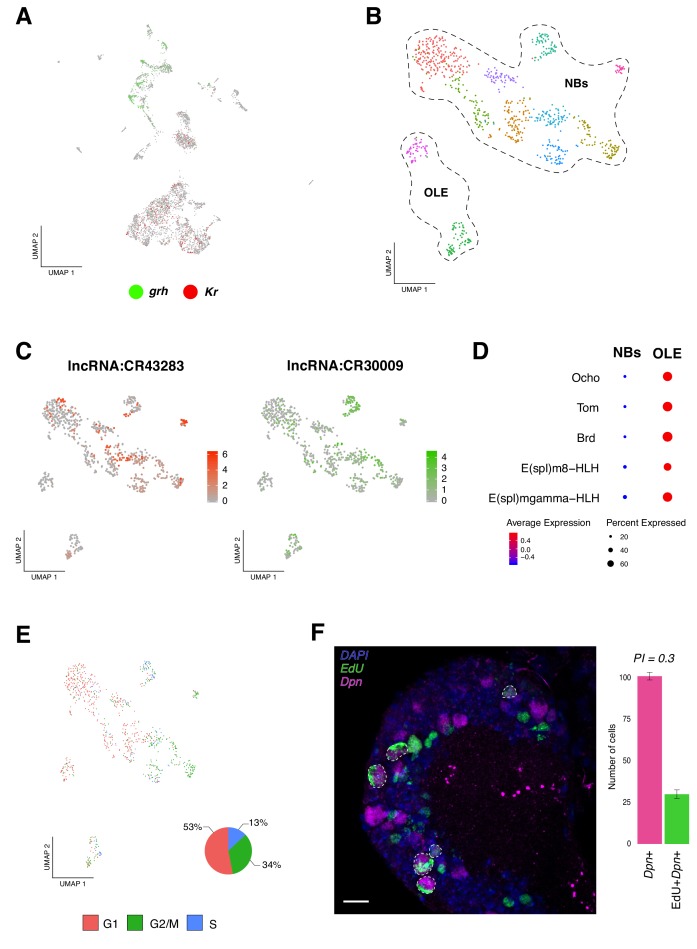
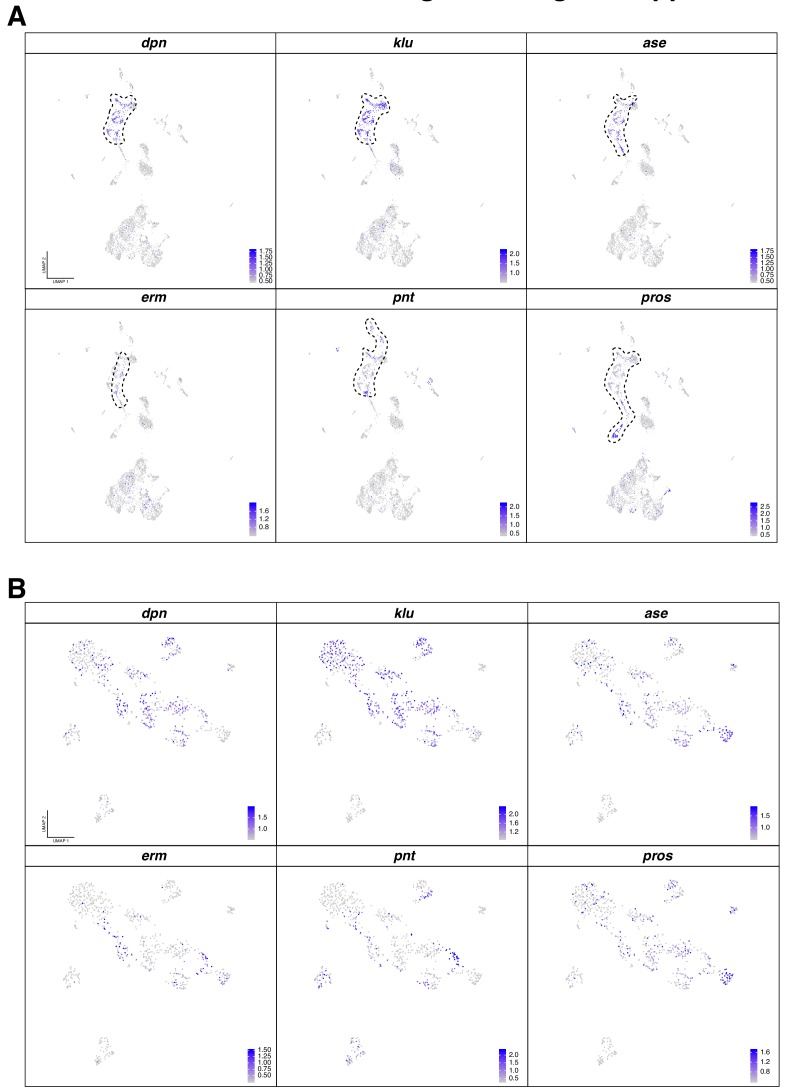
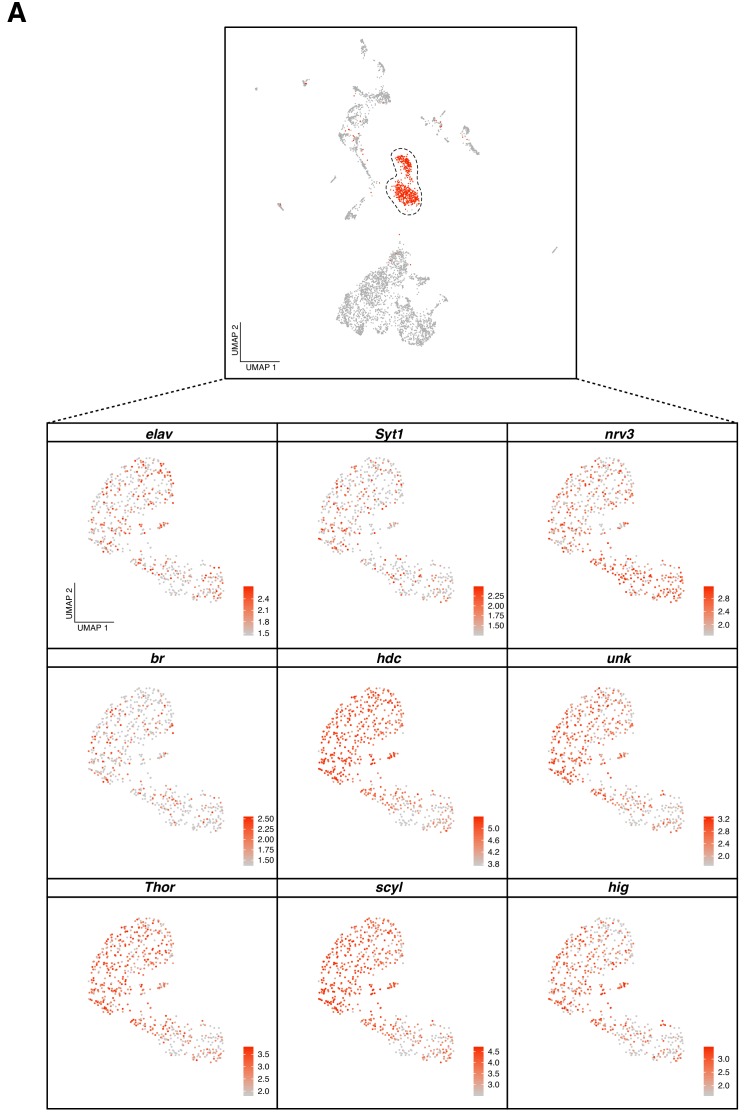
Figure 2. Identification of neural progenitor cell populations.
(A) Expression-pattern of genes from the temporal cascade distinguish population of cells. Two dimensions UMAP plot labeling genes from the temporal cascade. Grh, grainy head in green and Kr, Kruppel in red. Grh is broadly expressed in the recently born neuroprogenitors, while Kr is expressed in mature cells. (B) Re-analysis of the neurogenic populations by sub-clustering the original NPCs population, plotted in a Seurat UMAP plot, identifies 11 sub-populations of cells. NPCs are further divided into neuroblasts and optic lobe epithelium (OLE). (C) lncRNAs are present in NPCs expression profile. Color coded UMAP plot showing the abundance of long non-coding RNAs (lncRNAs). The scale represents gene expression levels. (D) OLE can be distinguished from the remaining neuroblasts based on the expression of characterized marker genes. Dot size corresponds to the percentage of cells expressing a particular gene, while color intensity represents gene expression levels. (E) Cell-cycle scores can be estimated transcriptionally. UMAP plot showing the different NPCs color coded based on cell-cycle phases. The pie graph illustrates the percentage of NPCs in each phase, G1, G2M and S. (F) EdU incorporation and NPCs proliferation. Immunostaining of the larval brain illustrating Dpn+ proliferating NPCs at 16 hr ALH. Proliferation index (PI) was calculated as the ratio between Dpn+EdU+ NPCs and Dpn+ NPCs. Error bars represent standard error. N = 5. Nuclei were labeled with DAPI. Scale bar: 20 µm.


