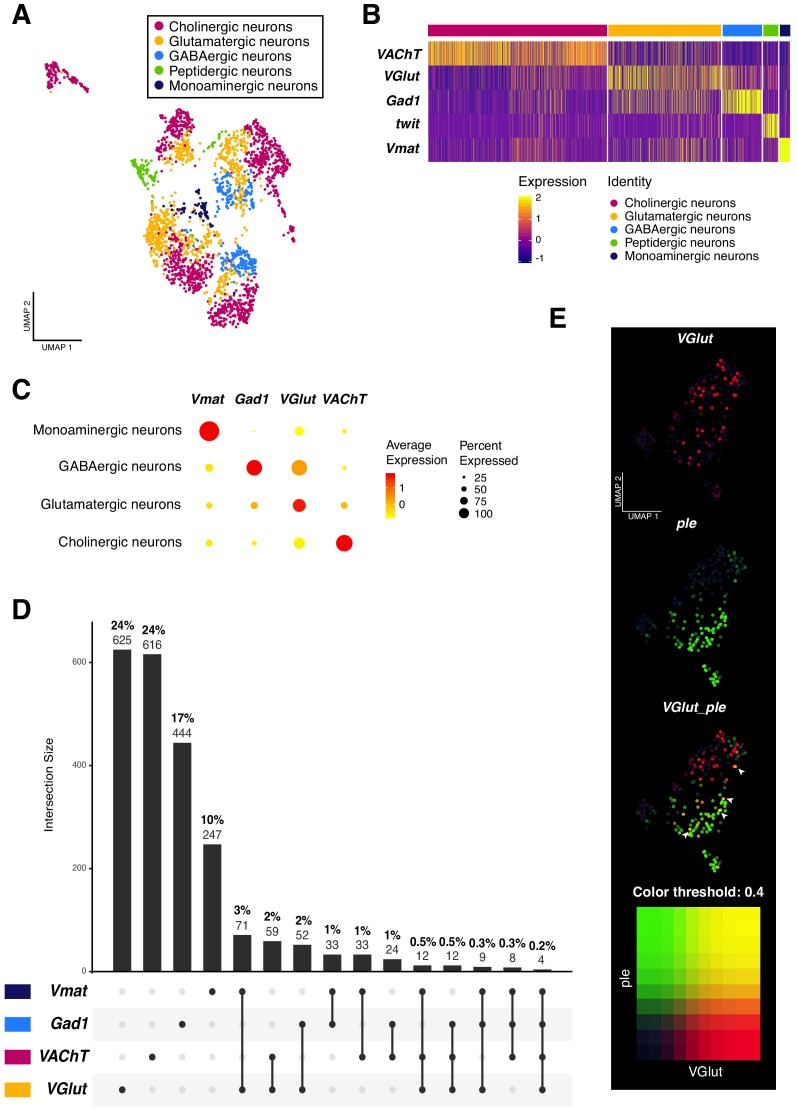
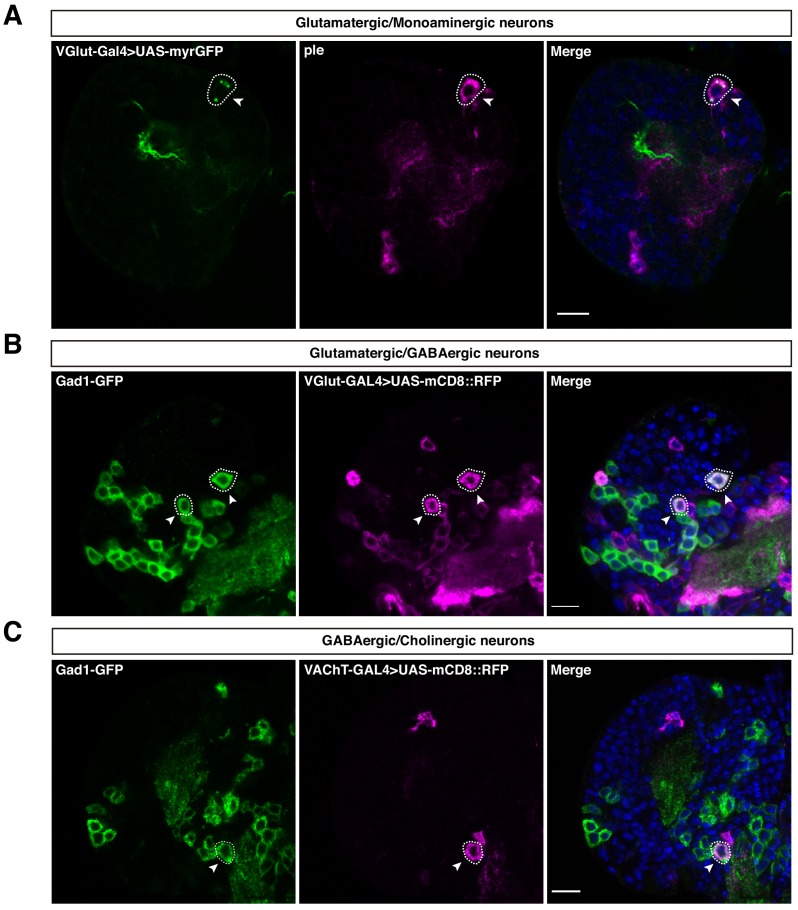
Figure 3. Neurotransmitter expression and co-expression in the larval neuronal population.
(A) Neurons are classified based on the expression of neurotransmitters. Seurat UMAP plot showing the distribution of the five main neuronal cell-types. (B) Simplified heatmap, representing neuronal subpopulations. Genes displayed are the main markers analyzed to identify neuronal cell-identities. The x axis represents individual cells, each line corresponds to one neuron. Gene expression levels are color coded. (C) Neurotransmitters are co-expressed in a subset of neurons. Dot size corresponds to the percentage of cells expressing a particular gene, while color intensity represents gene expression levels. (D) UpSet plot (Conway et al., 2017) illustrating the co-expression of neurotransmitters. Light and bold numbers represent number of cells and percentages of cells, respectively. The percentages were calculated based on positive cells for a particular neurotransmitter or a combination of them, in comparison to the total of neurons from the dataset. (E) Co-expression analysis based on the simultaneous expression of ple and VGlut. Blend UMAP plot showing only ple positive cells. Cells co-expressing ple and VGlut are shown in yellow. Threshold: 0,4.


