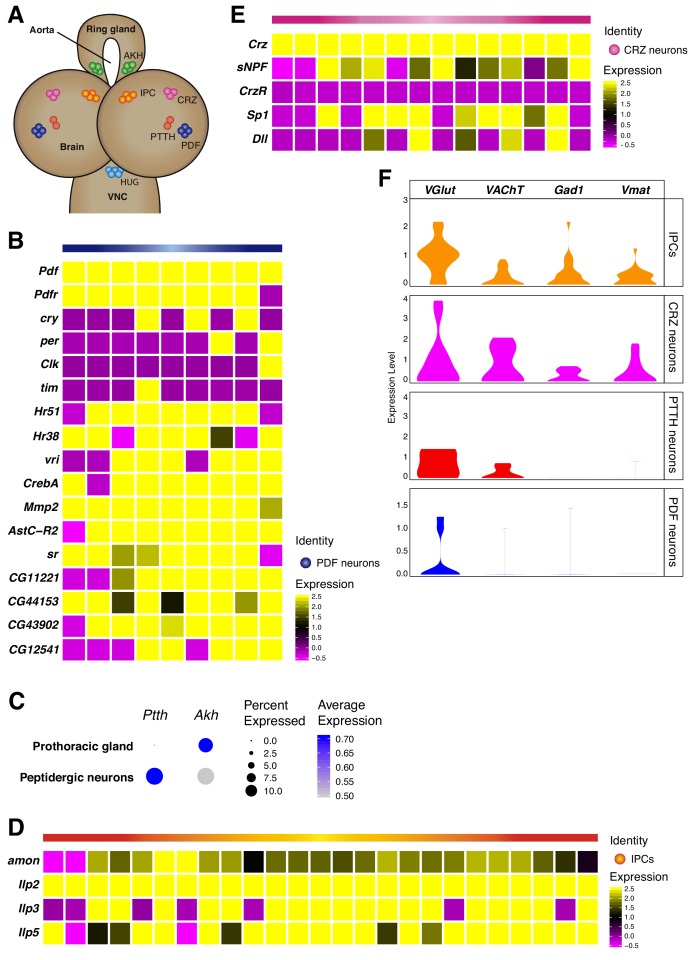
Figure 4. Neurosecretory cells distribution in the larval brain.
(A) Schematic representation of some neurosecretory cells present in the larval brain and the ring gland. VNC, ventral nerve cord. (B, D, E) Heatmaps showing gene expression profiles of PDF neurons, IPCs and CRZ neurons. In each case, only Pdf, Ilp2 and Crz highly positive cells were considered, respectively. White vertical lines separate individual cells, each column represents one cell. Gene expression levels are color coded. (C) Dot plot showing the presence of PTTH and Akh neurons, in peptidergic neurons and prothoracic gland, respectively. Dot size represents percentage of cells expressing a particular gene, while color intensity represents gene expression levels. (F) Neurosecretory cells express one or multiple neurotransmitters. Violin plot illustrating co-expression of neurotransmitters and neuropeptides. Violin plots represent the probability density of the data integrated with kernel density estimation. Wider sections of the violin plots represent a higher probability of cells with the indicated gene expression level, while skinnier sections represent lower probabilities.

