. 2019 Nov 13;8:e50566. doi: 10.7554/eLife.50566

Figure 1. Optogenetic activation of AWA sensory neurons elicits unreliable AIA calcium responses.

(A and B) AWA GCaMP2.2b (A) or AIA GCaMP5A (B) calcium responses to 10 s pulses of increasing concentrations of diacetyl and to AWA optogenetic stimulation. Bold lines indicate mean response, and light lines show individual traces. AWA traces to optogenetic stimulation were randomly downsampled to 40 traces from a complete set of 268 traces to match the number of odor traces and enhance visibility. AIA traces were randomly downsampled to 10 traces from a set of 34 (for 0–1.15 µM diacetyl) or 569 (for AWA::Chrimson stimulation). In all schematic diagrams, calcium was monitored in the neuron indicated in green, resistor symbols represent gap junctions, and thin arrows represent chemical synapses. (C and D) Heat maps of AWA (C) or AIA (D) calcium traces from (A) and (B), respectively. Responses to optogenetic stimulation were downsampled to 32 traces (C) or 34 traces (D) for visibility and to match sample sizes to diacetyl; see Figure 1—figure supplement 3A for complete data. Each heat map row represents a calcium trace to a single stimulus pulse; each animal received two stimulus pulses. Traces are ordered by response latency. (E) Representative AIA calcium traces to a given stimulus. Responses were sorted by response latency, binned into ten bins, then one trace was randomly selected from each bin for presentation. (F) Cumulative response time profiles of AWA and AIA responses representing response latencies and probability, without downsampling. Only first 5 s of stimulation are shown. Arrows indicate the delay between the time at which 50% of AWA neurons responded versus the time at which 50% of AIA neurons responded.

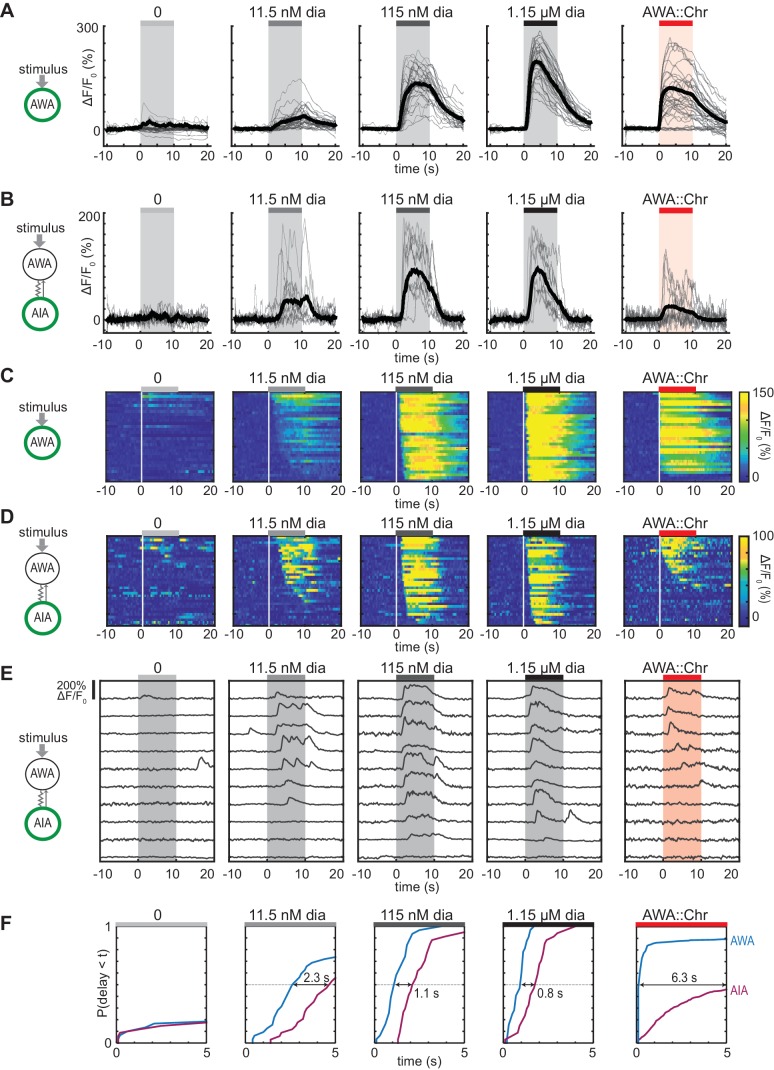
Figure 1—source data 1. Source data for Figure 1 and figure supplements.

Figure 1.

Figure 1—figure supplement 1. Experimental configuration and calibration of simultaneous GCaMP-Chrimson imaging conditions.

Figure 1—figure supplement 1.

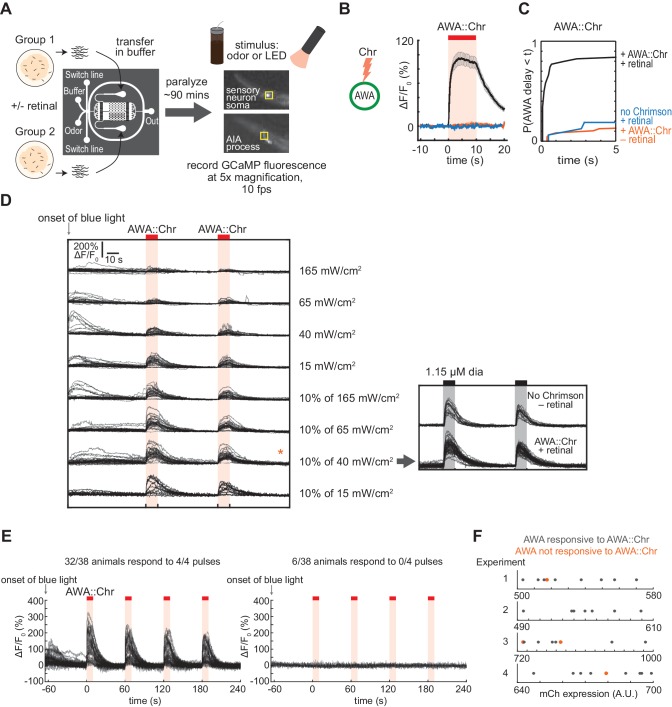
(A) Schematic of experimental configuration. Animals are paralyzed in a microfluidic device and their neural activity is recorded during exposure to odor or light. Two arenas can be recorded simultaneously with up to 10 animals per arena. See Materials and methods for details. (B and C) AWA requires both retinal pre-treatment and expression of the Chrimson transgene for responses to 617 nm light. (B) Mean AWA calcium responses; shading indicates ± SEM. Transgene with retinal: n = 74; transgene without retinal: n = 48; retinal without transgene: n = 16. (C) Cumulative response time profiles of data from (B), showing first 5 s of light exposure. (D) Individual AWA calcium responses to direct Chrimson excitation (617 nm) using various 474 nm light levels to excite GCaMP. Under strong illumination of GCaMP with 474 nm light (full power of LED, 165 mW/cm2), GCaMP fluorescence did not increase with subsequent 617 nm stimulation, presumably because of direct Chrimson excitation by 474 nm light. At lower 474 nm light levels (15–65 mW/cm2), or using a duty cycle with 10 ms of illumination every 100 s (10% of 40–165 mW/cm2), GCaMP fluorescence transiently increased but returned to a baseline that allowed a subsequent Chrimson response to 617 nm light. Chrimson responses were partly suppressed under continuous 474 nm illumination or at the highest light level at 10% illumination, suggesting some cross-activation. The 10% duty cycle at 40 mW/cm2 minimized the initial transient response to 474 nm while providing a strong signal to noise ratio at 617 nm. The 10% duty cycle at 15 mW/cm2 was too dim for AIA GCaMP experiments. In general, the 10 ms/100 ms duty cycle for 474 nm illumination is used for GCaMP experiments because strobing reduces motion artefacts, and because the duty cycle minimizes GCaMP photobleaching during long-term imaging. AWA had normal responses to 1.15 µM diacetyl when using the 10% duty cycle of 40 mW/cm2; this light level was used for all Chrimson experiments. Left: n = 20–25; Right: AWA::Chr, with retinal: n = 45; No Chrimson, no retinal: n = 16. (E) AWA calcium responses to four consecutive pulses of Chrimson excitation. AWA either responded to all or none of the Chrimson pulses, suggesting that variability in AWA responses to Chrimson is the property of an individual animal rather than a trial-to-trial property. Note that all experiments in other figures used two stimulus pulses, unless otherwise stated. (F) AWA::Chrimson::sl2::mCherry transgene expression levels for four separate experiments. Animals that responded to Chrimson excitation are in gray; animals that did not respond are in orange. There is no obvious correlation between mCherry expression level and the likelihood of AWA responses to light.
Figure 1—figure supplement 2. Validation of AIA response thresholding procedure.

Figure 1—figure supplement 2.

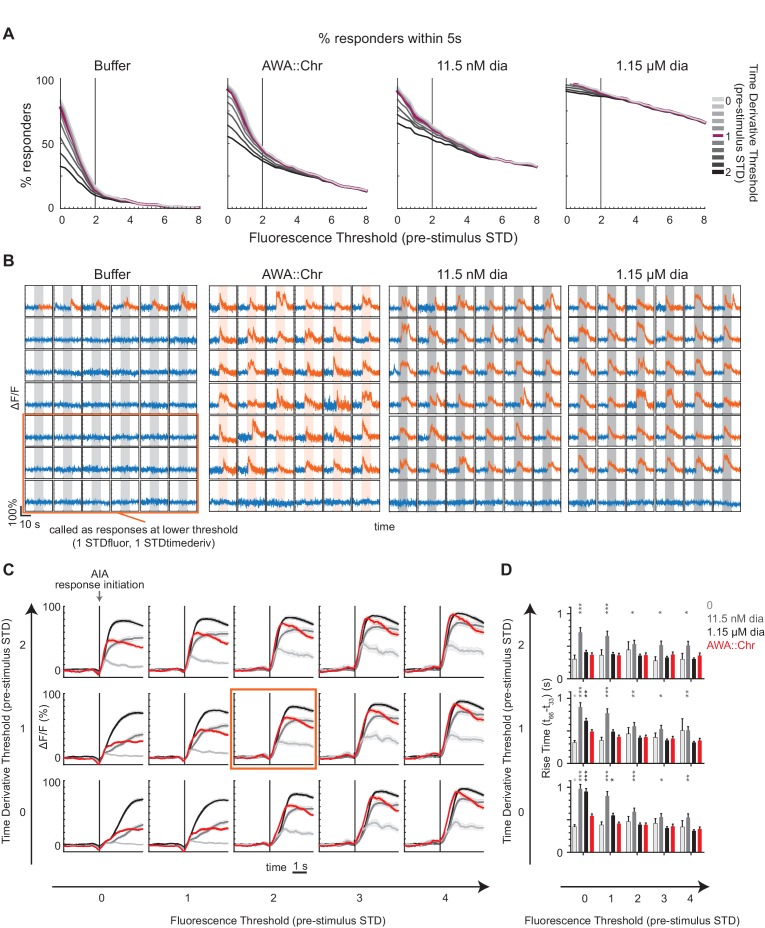
(A) Proportion of AIA calcium traces counted as ‘responses’ at varying fluorescence (x-axis) and time derivative (color axis) threshold parameters to various stimuli. Thresholds depend on the standard deviation (STD) of either fluorescence or time derivative of the 10 s window preceding the stimulus. A ‘response’ indicates that a frame t has fulfilled two criteria within 5 s of the stimulus onset: the mean fluorescence of t:t+12 frames exceeds the fluorescence threshold, and the mean time derivative of t:t+1 exceeds the time derivative threshold. A fluorescence threshold of 2 STD marks an inflection point in number of traces called ‘responses’ to pulses of buffer, such that a lower fluorescence threshold would include false positives. The time derivative threshold of 1 STD marks another inflection point such that higher thresholds begin to exclude events for all stimuli. All subsequent analyses use the thresholds of 2 STD for fluorescence and 1 STD for time derivative. The chosen time derivative threshold is useful for constraining the response timing for latency analyses rather than excluding traces based on slope or shape. Buffer: n = 297; AWA::Chr: n = 569; 11.5 nM diacetyl: n = 230; 1.15 µM diacetyl: n = 438. (B) Representative selection of individual AIA calcium traces deemed ‘responses’ or ‘nonresponses’ to various stimuli. Traces that are completely blue were deemed ‘nonresponses’ using the chosen threshold of 2 STD for fluorescence and 1 STD for time derivative. Traces in both blue and orange were deemed ‘responses’ at the color transition. Orange box shows a subset of traces that were deemed ‘nonresponses’ at the chosen threshold but were deemed ‘responses’ at the lower threshold of 1 STD for fluorescence and 1 STD for time derivative. (C) AIA ‘responses’ to various stimuli at given threshold parameters, aligned to the initiation of each response rather than stimulus onset, and averaged. Only calcium traces that were called ‘responses’ within 5 s into stimulus are included. Threshold parameters used in this study (2 STD for fluorescence; 1 STD for time derivative) are indicated by the orange box. Shading indicates ± SEM. (D) Rise times of AIA ‘responses’ to various stimuli and threshold parameters. Error bars show SEM. Asterisks refer to significance of one-way ANOVA with Dunnett’s multiple comparisons test, using AWA::Chrimson as the comparison stimulus. No asterisks: not significant; *: p<0.05; **: p<0.01; ***: p<0.001.
Figure 1—figure supplement 3. Sequential imaging of AIA responses to odor or AWA::Chrimson stimulation.

Figure 1—figure supplement 3.

(A) Heat maps of AWA and AIA responses to AWA::Chrimson stimulation, combined over all experiments. AWA: n = 268; AIA: n = 569. (B) Delay between the time at which 50% of AWA versus 50% of AIA neurons responded to various stimuli. Delay was greatest for AWA::Chrimson stimulation. Bars are mean ± SEM. (C) Cumulative response time profiles of AIA responses to 1.15 µM diacetyl recorded immediately after recordings of AWA::Chrimson stimulation (blue), representing a subset of animals used in (A). AIA responses to 1.15 µM diacetyl combined over all experiments are shown for comparison (black). (D) Response latencies of 318 AIA responses to AWA::Chrimson stimulation do not correlate with GCaMP fluorescence levels at pre-stimulus baseline. (E) Response latencies of 31 responses to AWA::Chrimson stimulation do not correlate with Chrimson transgene expression levels. (F) Representative AIA calcium traces to two pulses of AWA::Chrimson stimulation. AIA can response to the first pulse only, second pulse only, both pulses, or neither pulse. (G, K, and O) Cumulative response time profiles of AIA responses to the first or second stimulation with AWA::Chrimson (I), 11.5 nM diacetyl (L), or 1.15 µM diacetyl (O). Only animals for which both trial pulses yielded usable results were included (e.g. for AIA::Chrimson, 282/287 animals). All other figures and analyses beyond this supplement pool responses to both pulses. (H, L, and P) Proportion of animals that respond to only the first, second, both, or neither pulse of stimulation with AWA::Chrimson (H), 11.5 nM diacetyl (L), or 1.15 µM diacetyl (P). Some of the 22% of animals that did not respond to either AWA::Chrimson pulse may be the result of AWA::Chrimson transgene failure (~15% failure rate; see Figure 1—figure supplement 1E); transgene failure does not explain the large proportion of animals that responded to one of two pulses, nor does it explain variability in response latencies. (I and J) In 98 animals that responded to both AWA::Chrimson stimulation pulses, there was no correlation between response latencies across pulses (I), but response magnitudes were correlated across pulses (J). (M and N) In 72 animals that responded to both 11.5 µM diacetyl pulses, there was no correlation between response latencies across pulses (M), but response magnitudes were correlated across pulses (N). (Q and R) In 187 animals that responded to both 1.15 µM diacetyl pulses, there was a moderate correlation between response latencies (Q) and a correlation between response magnitudes (R) across pulses. Three outlier data points were excluded from (R) but were included in analysis. For (C), (G), (K), and (O), asterisks refer to Kolmogorov-Smirnov test significance over full 10 s stimulus pulse. ns: not significant; *: p<0.05; **: p<0.01; ***: p<0.001. See Supplementary file 2 for sample sizes and test details. For (D), (E), (I), (J), (M), (N), (Q) and (R), asterisks refer to significance of linear regression slope differing from 0. ns: not significant; ***: p<0.001.