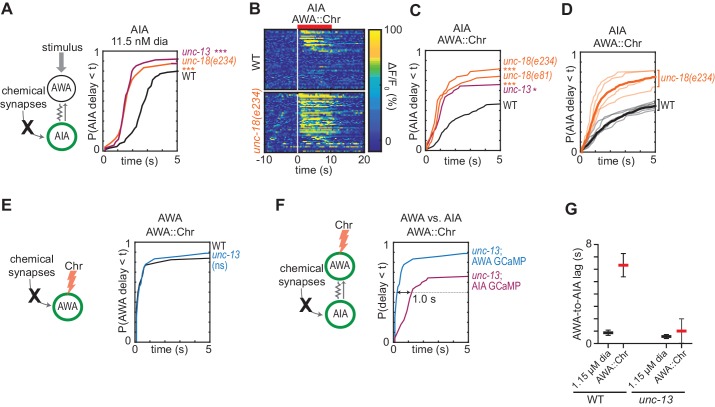
Figure 3. Chemical synapses inhibit AIA.
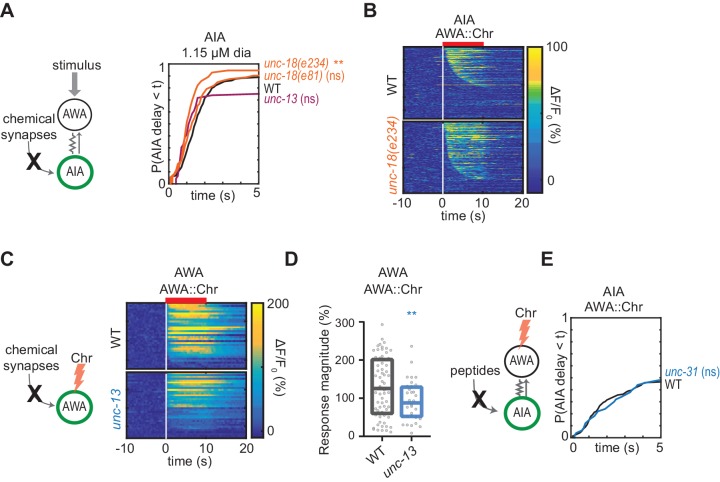
(A) Cumulative response time profiles of AIA responses to 11.5 nM diacetyl in WT versus unc-13(e51) and unc-18(e234) animals (synaptic transmission mutants). (B) Heat maps of AIA responses to AWA::Chrimson stimulation in WT and unc-18(e234) animals. WT data were randomly downsampled to 57 traces for visibility and to match number of unc-18(e234) traces; data shown for single experiment block. See Figure 3—figure supplement 1B for pooled data from all experiments. (C) Cumulative response time profiles of AIA responses to AWA::Chrimson stimulation in WT versus unc-13, unc-18(e234), and unc-18(e81) animals. (D) Cumulative response time profiles of WT and unc-18(e234) response time profiles, combined over all experiments. Thick lines represent distributions of all data, faint lines represent distributions from individual experimental blocks. (E) Cumulative response time profiles of AWA responses to AWA::Chrimson stimulation in WT versus unc-13 animals. (F) Cumulative response time profiles of AWA and AIA responses to AWA::Chrimson stimulation in unc-13 animals. Arrow indicates the delay between the time at which 50% of AWA versus 50% of AIA neurons have responded. (G) Delay between the time at which 50% of AWA versus 50% of AIA neurons responded to 1.15 µM diacetyl and AWA::Chrimson stimulation in WT and unc-13 animals. WT responses are the same as in Figure 1—figure supplement 3B. Bars are mean ± SEM. Asterisks refer to Kolmogorov-Smirnov test significance versus WT over full 10 s stimulus pulse. ns: not significant; *: p<0.05; ***: p<0.001. See Supplementary file 2 for sample sizes and test details. Additional heat maps of data from Figure 3 appear in Figure 3—figure supplement 1.


