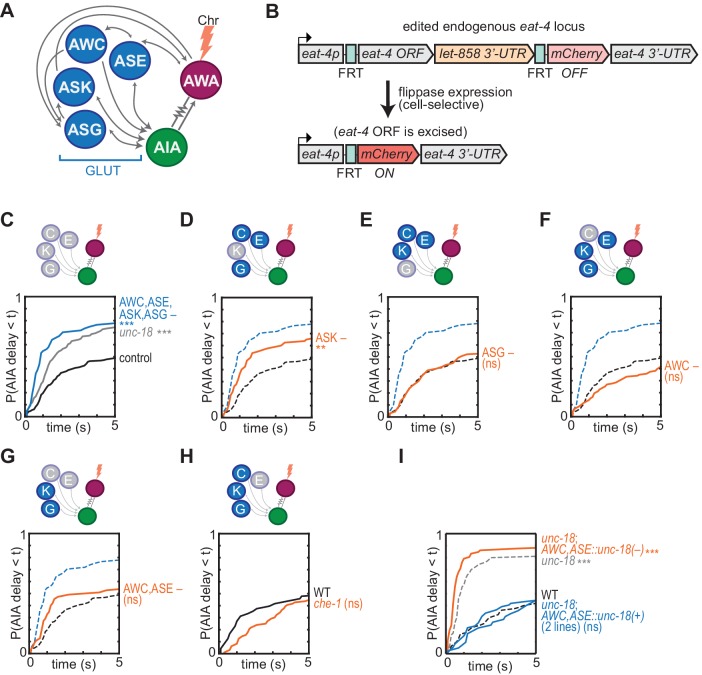
Figure 4. Glutamatergic sensory neurons cooperate to inhibit AIA.
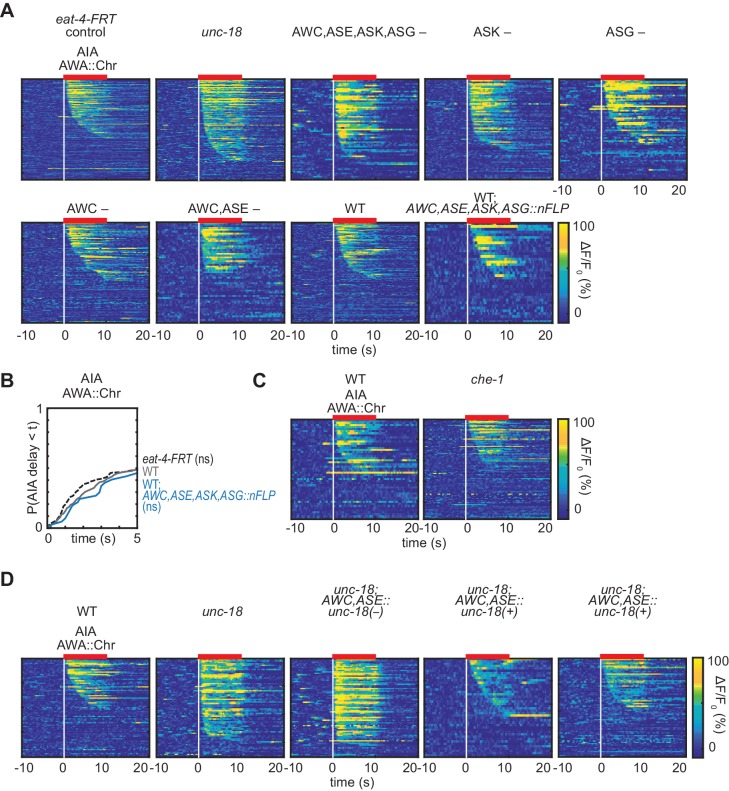
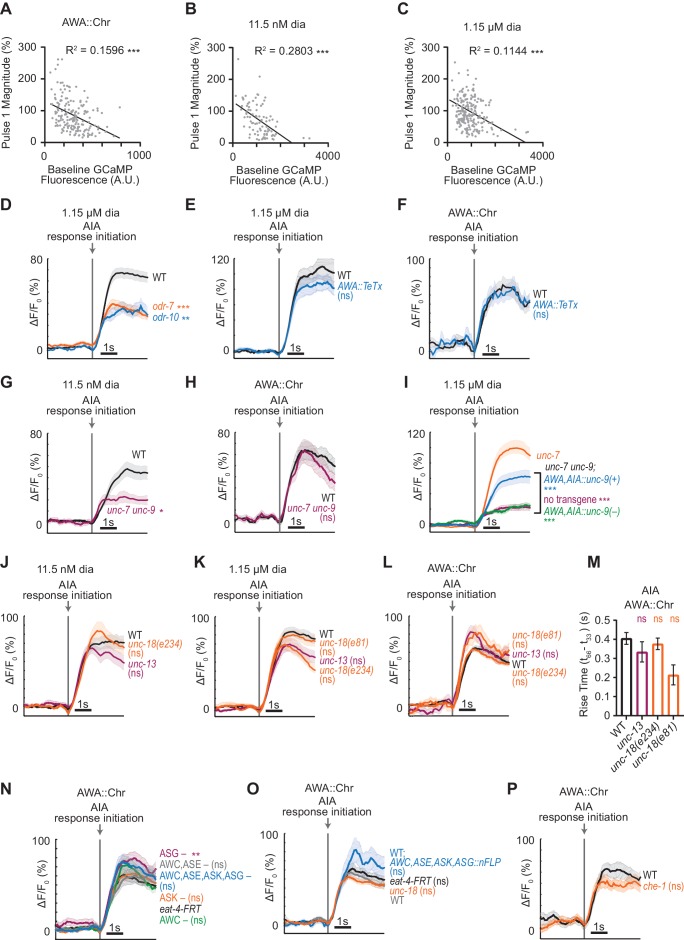
(A) Simplified diagram of connections between AWA, AIA and four glutamatergic sensory neurons, based on White et al. (1986). (B) Schematic of cell-selective glutamate knockout genetic strategy (López-Cruz et al., 2019). The eat-4 locus is excised only in the presence of flippase. ORF: open reading frame; UTR: untranslated region; FRT: flippase recombinase target. (C–H) Cumulative response time profiles of AIA responses to AWA::Chrimson stimulation in various animals lacking either glutamate release or cellular function of specific sensory neurons. For (D–G), dotted black and blue lines are control and eat-4-FRT; AWC,ASE,ASK,ASG::nFlippase, respectively, from (C). (C) Control (eat-4-FRT genetic background with no flippase expression), unc-18, and eat-4-FRT; AWC,ASE,ASK,ASG::nFlippase animals. (D) eat-4-FRT; ASK::nFlippase animals. (E) eat-4-FRT; ASG::nFlippase animals. (F) eat-4-FRT; AWC::nFlippase animals. (G) eat-4-FRT; AWC+ASE::nFlippase animals. (H) WT and che-1 animals (ASE cell fate mutants). (I) Cumulative response time profiles of AIA responses to AWA::Chrimson stimulation in WT, unc-18 animals, unc-18; AWC,ASE::unc-18(+) transgenic rescue animals (two lines), and unc-18; AWC,ASE::unc-18(e234) transgenic control animals. Asterisks refer to Kolmogorov-Smirnov significance versus eat-4-FRT controls (C–G) or WT (H, I) over full 10 s stimulus pulse. ns: not significant; **: p<0.01; ***: p<0.001. See Supplementary file 2 for sample sizes and test details. Heat maps of data from Figure 4 appear in Figure 4—figure supplement 1. Additional representations of data from Figures 1–4 appear in Figure 4—figure supplement 2.


