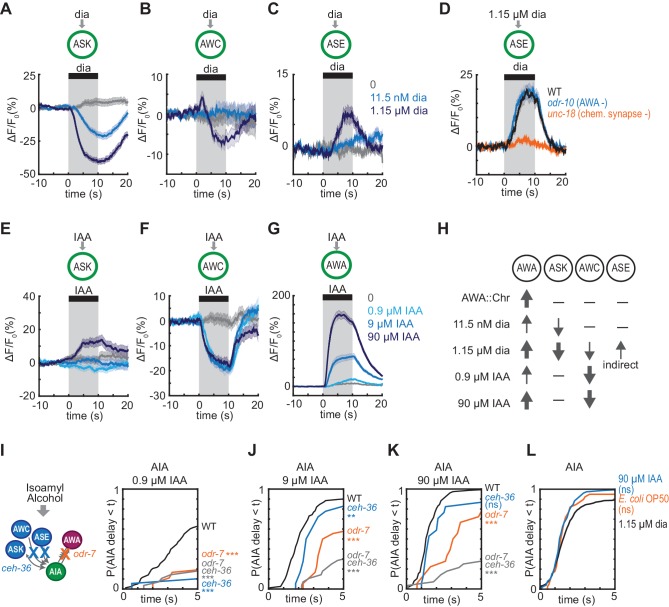
Figure 5. Multiple sensory neurons detect diacetyl and isoamyl alcohol.
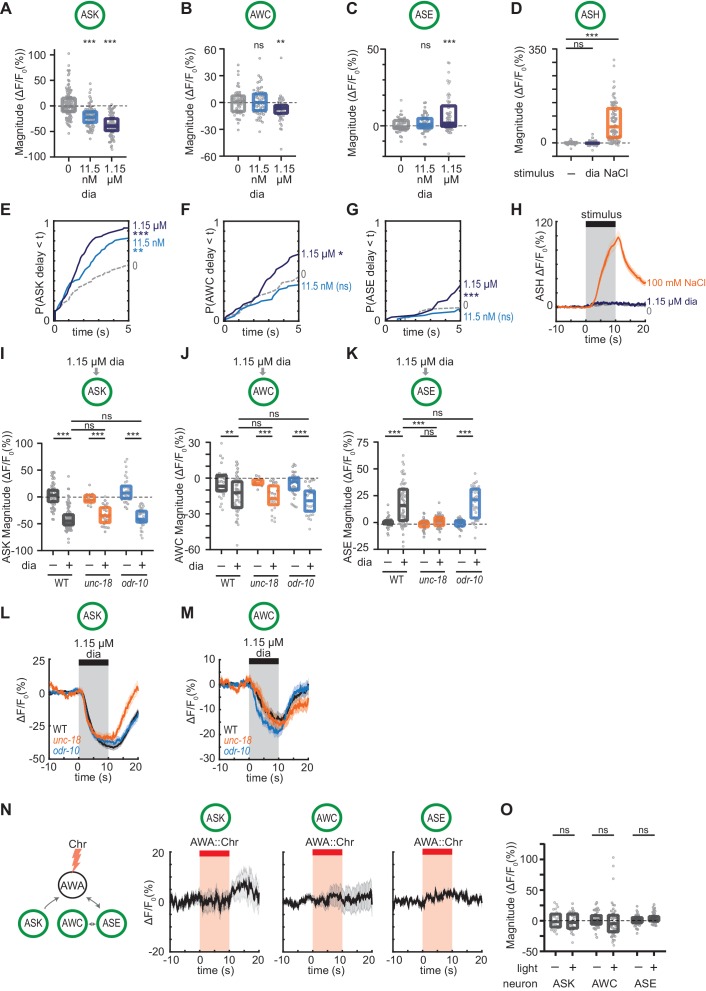
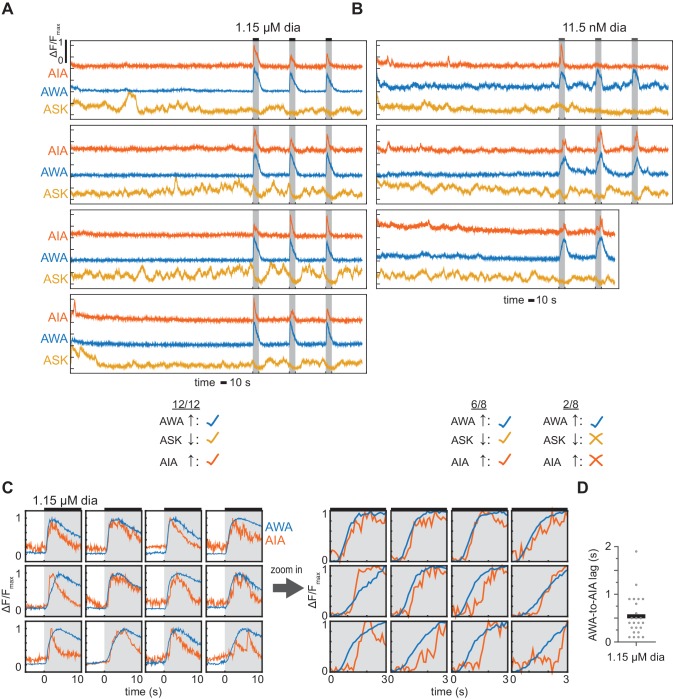
(A – C) Mean ASK (A), AWC (B), and ASE (C) responses to 10 s pulses of buffer (0) or 11.5 nM or 1.15 µM diacetyl. ASK: n = 82–115; AWC: n = 52–60; ASE: n = 42–54. Shading indicates ± SEM. (D) Mean ASE responses to 1.15 µM diacetyl in WT versus unc-18 animals (synaptic transmission mutants) and odr-10 animals (AWA diacetyl receptor mutants). ASE responses in unc-18 animals are greatly diminished. Shading indicates ± SEM. (E – G) Mean ASK (E), AWC (F), and AWA (G) responses to 10 s pulses of buffer (0), 0.9 µM, 9 µM, or 90 µM isoamyl alcohol. ASK: n = 60; AWC: n = 42; AWA: n = 78–80. Shading indicates ± SEM. (H) Summary of sensory neuron responses to various stimuli. Upward arrows indicate activation; downward arrows indicate inhibition. Arrow thickness reflects response magnitude. (I – K) Cumulative response time profiles of AIA responses to 0.9 µM (I), 9 µM (J), or 90 µM (K) isoamyl alcohol in WT versus odr-7 animals (AWA cell fate mutants), ceh-36 animals (AWC and ASE cell fate mutants), and odr-7 ceh-36 animals. (L) Cumulative response time profiles of AIA responses to 1.15 µM diacetyl, 90 µM isoamyl alcohol, and E. coli OP50 bacteria-conditioned medium. Asterisks refer to Kolmogorov-Smirnov test significance versus buffer over full 10 s stimulus pulse. ns: not significant; *: p<0.05; **: p<0.01; ***: p<0.001. See Supplementary file 2 for sample sizes and test details.


