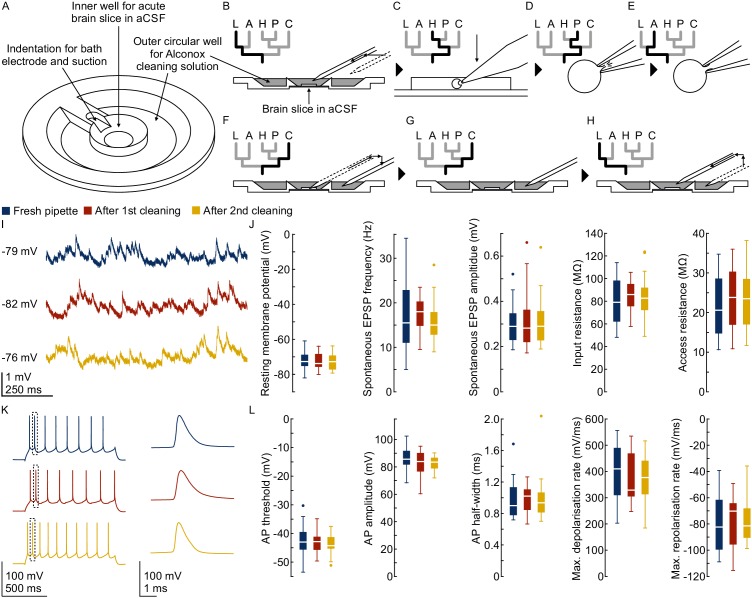
Figure 3. Pipette cleaning protocol.
(A) Design of custom-made recording chamber with one centre well for the brain slice and recording solution and another circular outer well for the cleaning solution, see construction design in Appendix 1—figure 1 and 2. (B–H) Experimental steps for pipette cleaning. Tree diagrams on the top left depict the configuration of the pressure system with the following pressure levels: LOW, ATMOSPHERE, HIGH, PATCH, CLEAN. (B) Pipettes are moved into the recording solution with LOW pressure. (C) Cells are approached with HIGH pressure. (D) Formation of gigaseal and membrane rupture with pressures applied through the PATCH channel with either mouth piece or syringe. (E) Cells are kept at ATMOSPHERE pressure after successful patch. (F) Pipettes are moved into the cleaning solution and switched to CLEAN pressure. (G) Cleaning pressure sequence is applied in the outer well. (H) Pipettes are moved back into the recording solution above the slice and switched to LOW pressure. (I) Current clamp traces at resting membrane potential exhibiting spontaneous EPSPs recorded using the same pipette before (blue) and after cleaning (red and yellow). (J) Box plots of cellular, synaptic and recording properties of cells recorded with fresh (blue, n = 25, except n = 23 for synaptic parameters) and cleaned pipettes (red, n = 21 and yellow, n = 21). (K) Action potential firing patterns elicited through step current injection and enlarged action potential traces recorded on the same pipette before (blue) and after cleaning (red and yellow). (L) Box plots of action potential properties of cells recorded with fresh (blue, n = 25) and cleaned pipettes (red and yellow, n = 21). Further statistical information and analysis are shown in Figure 3—source data 1.
Figure 3—figure supplement 1. Fresh pipette vs. cleaned pipette.
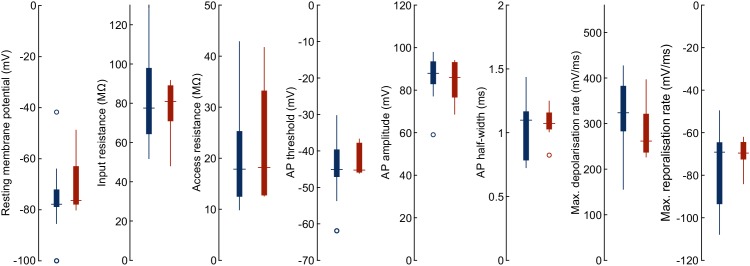
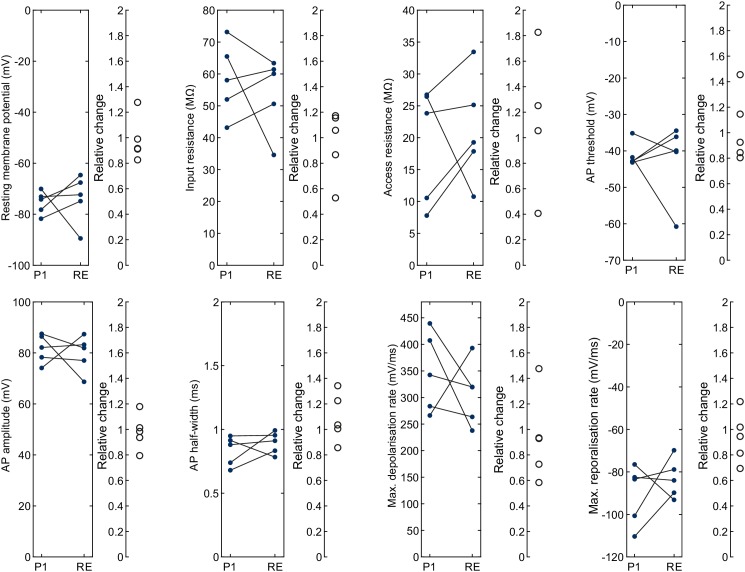
Figure 3—figure supplement 2. Fresh pipette vs. repatch of same cell with cleaned pipette.
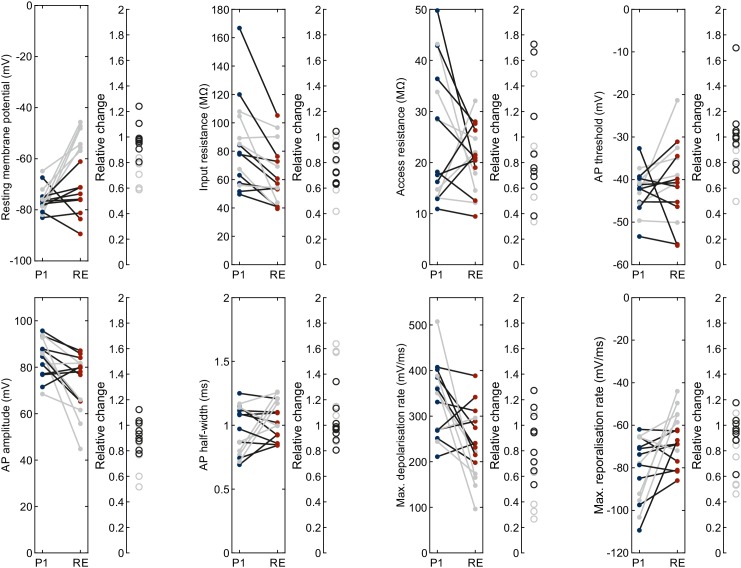
Figure 3—figure supplement 3. Fresh pipette vs. repatch with fresh pipette.
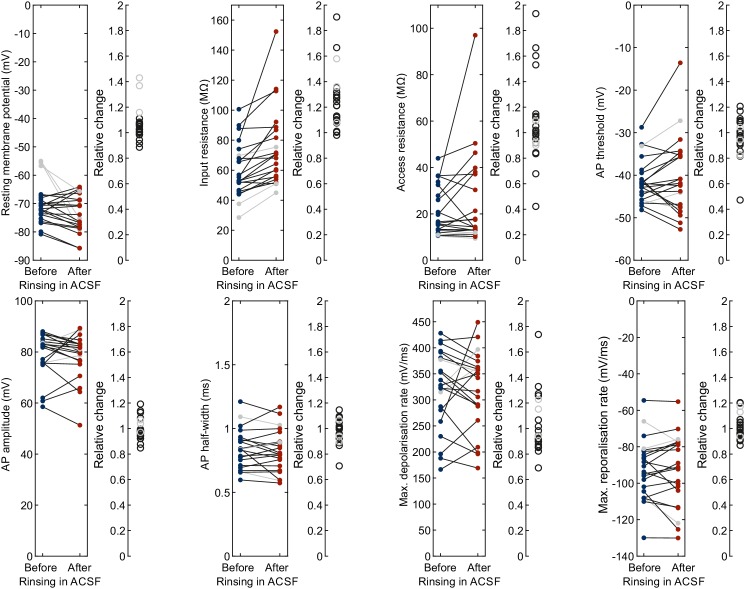
Figure 3—figure supplement 4. ACSF before vs. after rinsing during cleaning.
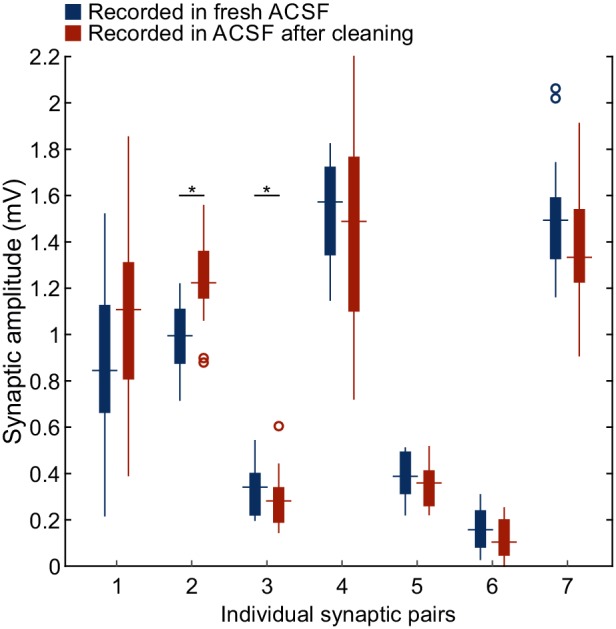
Figure 3—figure supplement 5. Synaptic amplitudes recorded in ACSF before vs. after rinsing during cleaning.
