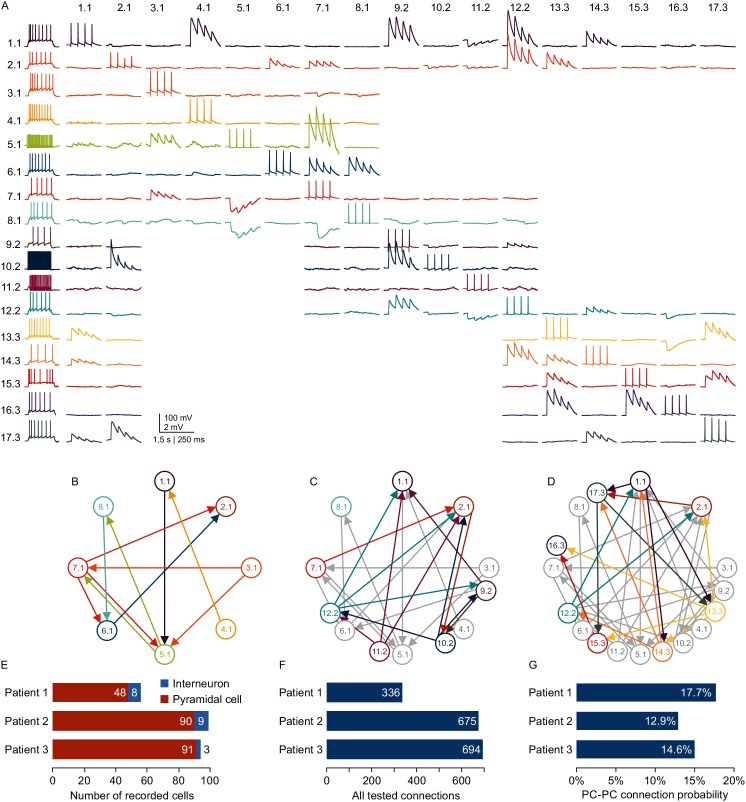
Figure 6. Microcircuit analysis in human slices.
(A) Matrix of averaged voltage traces from 17 neurons in one acute human slice recorded on the -manipulator setup with two rounds of clean-to-extend. Left column shows the firing pattern of the recorded neurons. In the first session eight neurons were patched simultaneously (cells numbered 1.1–8.1). Traces recorded from one cell are shown in a row with the same color. Four action potentials were elicited in each neuron consecutively (diagonal of the matrix). The postsynaptic responses of the other neurons are aligned in the same column. After recording of the first full cluster of 8eight neurons, four pipettes were cleaned and additional neurons in the vicinity were patched and recorded with the same stimulation protocol (9.2–12.2). After the second recording session, another five pipettes were subject to cleaning and five new neurons were patched, while the pipettes on neuron 1.1, 2.1 and 12.2 were not removed. This allowed screening of additional connections among the neurons from the third recording session (13.3–17.3) and also connections between neurons from previous recording sessions (1.1, 2.1 and 12.2). Scale bar: Horizontal 1.5 s for firing pattern, 250 ms for connection screening. Vertical 100 mV for action potentials, 2 mV for postsynaptic traces. (B) Connectivity scheme of all neurons from the first recording session with arrows indicating a detected synaptic connection. (C) Scheme of connections after first cleaning round. Colored arrows and circles indicate neurons and connections recorded in the second session. Neurons and connections of the first recording session are shown in gray. (D) Scheme of all recorded neurons and detected connections after two cleaning rounds. Neurons and connections recorded in this third session are colored. Neurons and connections from previous recording sessions are shown in gray. In this slice, a total of 38 synaptic connections were detected out of 150 tested connections. (E) Bar graphs depicting number of recorded interneurons and pyramidal cells from three patients recorded within the first 24 hr after slicing. (F) Number of tested connections in each patient recorded within the first 24 hr. (G) Connection probability between pyramidal cells calculated by the number of found to tested connections recorded within the first 24 hr. See Figure 6—source data 1.

