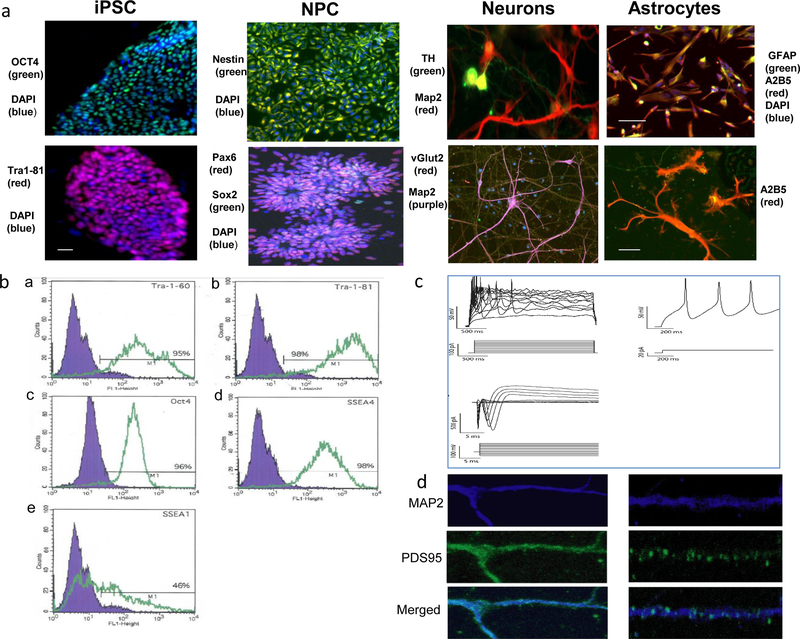
Figure 1. Generation of iPSCs and neural derivatives.
a, Representative images of induced pluripotent stem cells (iPSCs) and their neural derivatives subjected to immunocytochemical analysis of pluripotency and neural cell differentiation. Far left: iPSCs showed the typical morphology of human embryonic stem cells (hESCs) and positive staining for pluripotency markers OCT4 (green) and DAPI (blue) (upper panel); Tra1–81 (red) and DAPI (blue) (lower panel). Second from left: iPSC-derived neural progenitor cells (NPCs) immunostained positive for neural lineage markers Nestin (green) and DAPI (blue)(upper panel), Pax6 (red), Sox2 (green) and DAPI (blue) (lower panel) scale bar: 50 μm. Third from left: iPSC-derived neurons expressed neural markers MAP2 (red), TH (green), (upper panel), MAP2 (green) and vGlut2 (red) (lower panel). Far right: Astrocytes generated from NPCs exhibited typical astrocyte morphology and expressed astrocyte markers GFAP (green), A2B5(red) and and DAPI(blue) (upper panel) scale bar: 50 μm; and A2B5 (red) (lower panel), scale bar: 10 μm. b, Human induced pluripotent stem cells were subjected to flow cytometric to analysis with pluripotency markers. In the merged image, the blue area shows the fluorescence intensity of the IgG negative control antibody, while intensities of the antibodies of interest are shown in green. Results of negative control and iPSC lines are shown in (a) Tra-1 60 (9%, 95%), (b) Tra_1 81 (5%, 98%), (c) OCT4 (4%, 96%), (d) SSEA-4 (3%, 98%), and (e) SSEA-1(10%, 46%). c, Representative traces from whole cell-patch clamp recordings in 6-week post-differentiation neurons, demonstrating typical electrophysiological activity. d, Immunochemical staining of MAP2 (blue) and PSD95 (green) in 6-week neurons, demonstrating typical synapse staining patterns.

